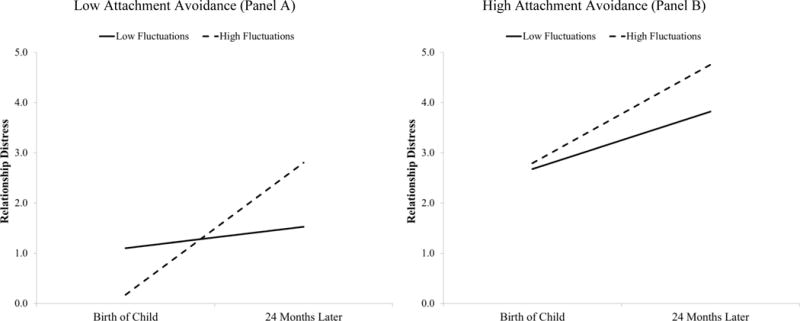
Figure 7.

Linear changes in relationship distress over time as a function of baseline relationship-specific attachment avoidance, moderated by low (Panel A) versus high (Panel B) fluctuations in relationship-specific attachment avoidance (Study 3).
Note. High and low values of attachment avoidance and fluctuations in attachment avoidance are indexed 1 SD below and above the mean.
