
Figure 16.
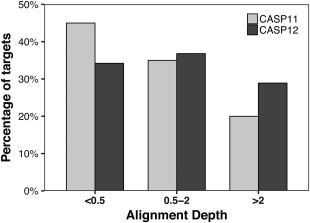
Distribution of sequence depth over all targets for CASP11 (white light gray) and CASP12 (black) for targets with low (<0.5), medium (0.5‐2), and high alignment depth. Alignment depth values were calculated from the outputs of HHblits and PSI‐BLAST as described previously10 using the latest databases available after closure of the prediction window for each target