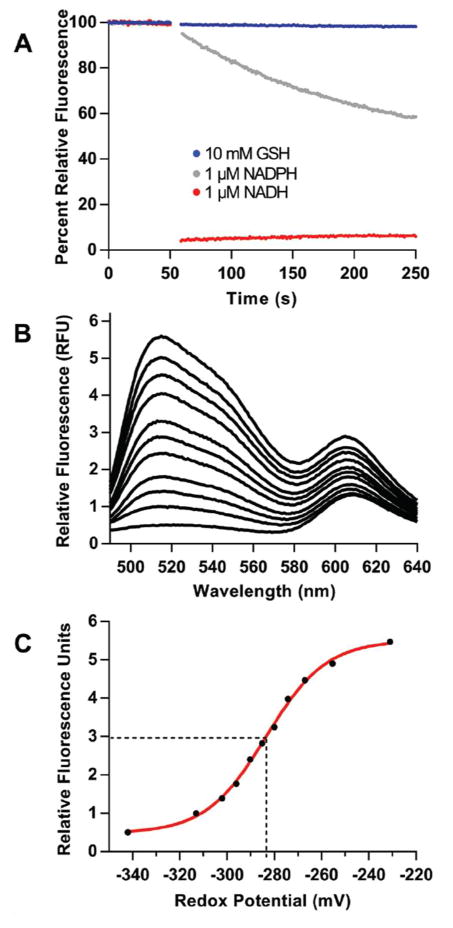
Figure 10.
Characterization of LipDH-mCherry. Panel A shows that the probe responds rapidly to 1 μM NADH, while being insensitive to glutathione and NADPH. Panel B depicts the fluorescence spectra of LipDH-mCherry after treatment with a series of mixtures of NAD+ and NADH totaling 200 μM; from all NAD+ (top curve) to solely NADH (bottom line). The fluorescence amplitude at 520 nm is plotted in panel C against the redox potential of the NAD+/NADH mixtures as calculated from the Nernst equation (see Methods) yielding the standard redox potential of the LipDH-mCherry probe.

