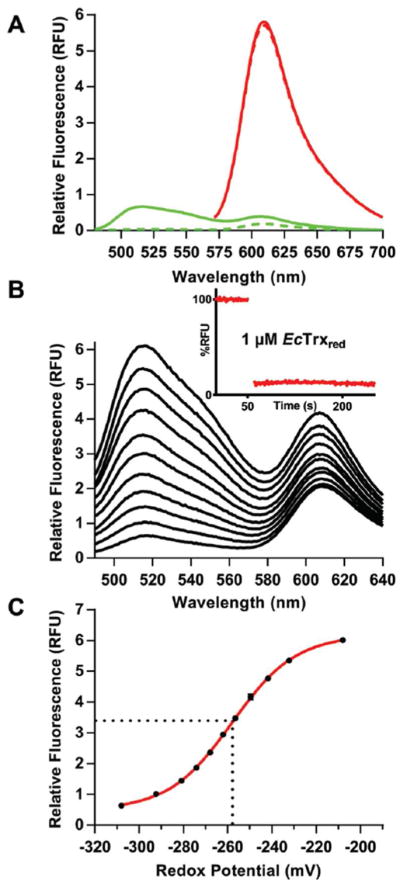
Figure 5.

Characterization of TrxRGV-mCherry. Panel A shows the emission spectra of 1 μM of TrxRGV-mCherry before (solid line) and after reduction with 20 μM tris-hydroxpropylphosphine (THP, dashed line; see Methods) exciting into the flavin excitation envelope (456 nm; green curves) or into the mCherry chromophore using 520 nm light (red curves). Panel B represents the oxidized probe (top line) progressively reduced with mixtures of reduced and oxidized thioredoxin totaling 200 μM. The inset shows that the equilibration between TrxRGV-mCherry and reduced thioredoxin is rapid; even with 1 μM reagents. Panel C plots the amplitude of the 520 nm signal in Panel B against the redox potential of the mixture calculated from the Nernst equation. The standard redox potential of the probe was calculated to be −258 ± 1 mV (see Methods).
