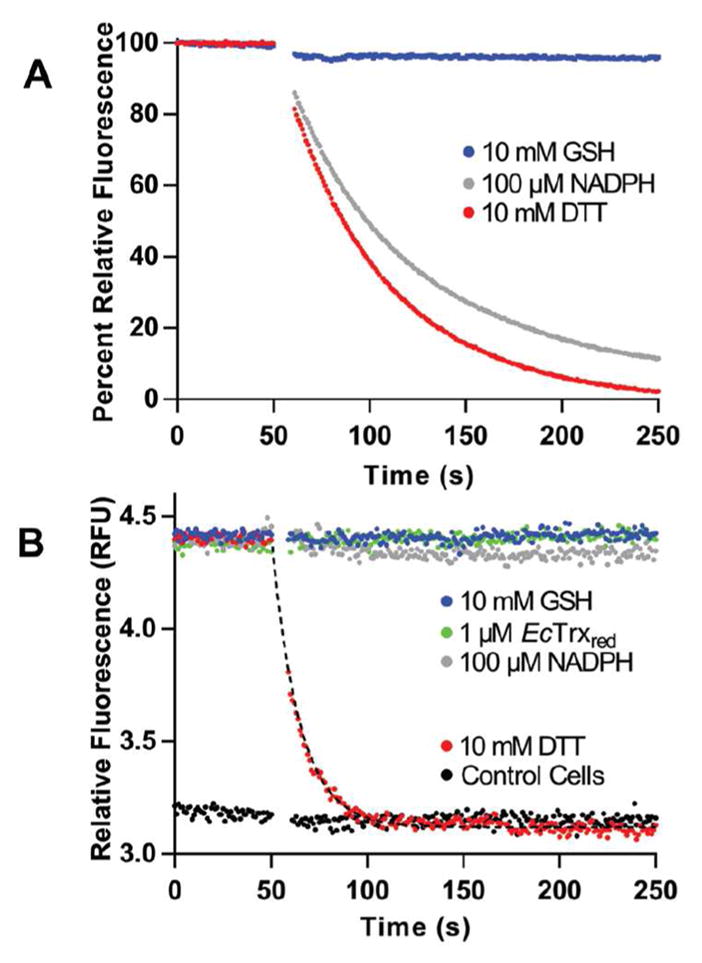
Figure 6.

Reduction of TrxRGV-mCherry in vitro and in E. coli. Panel A shows the fluorescence of 1 μM probe mixed at 50 s with 10 mM of GSH or DTT or with 0.1 mM NADPH. Reduction for DTT and NADPH show half-times of 37 ± 2 s and 48 ± 2 s respectively analyzed by exponential fit. Panel B represents the fluorescence of E. coli cells expressing the thioredoxin probe before and after the addition of the indicated reagents. The lower lines represent a corresponding E. coli strain lacking the plasmid for TrxRGV-mCherry.
