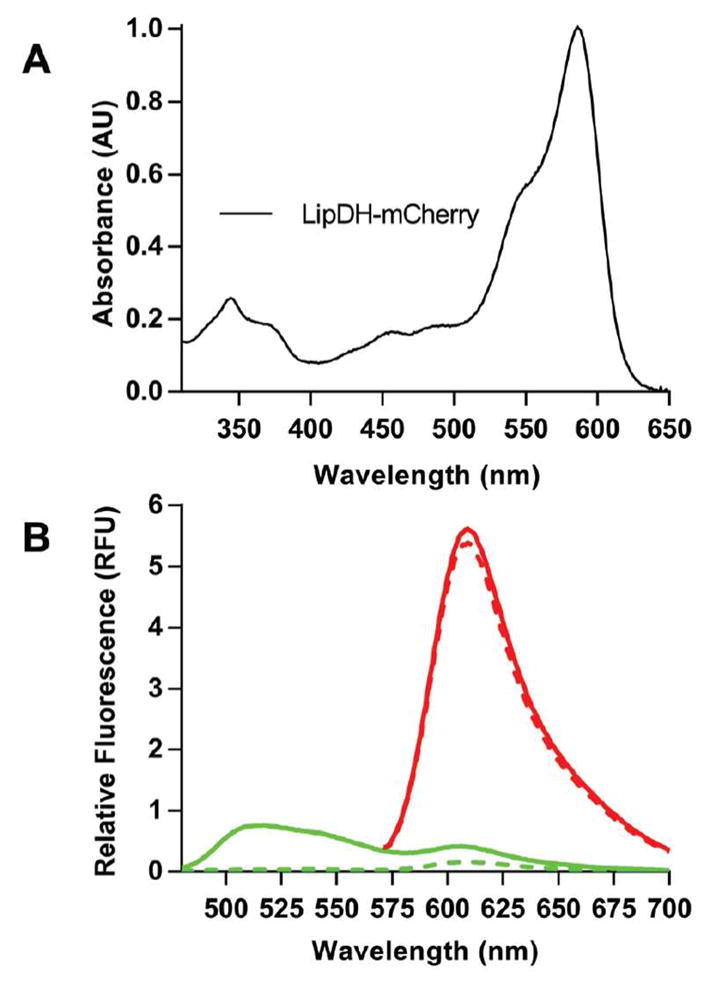
Figure 9.

UV-Vis and fluorescence spectra of the LipDH-mCherry NAD+/NADH sensor. Spectra were recorded in 50 mM phosphate buffer, pH 7.5, containing 1 mM EDTA. Panel B shows the emission spectra of 1 μM of LipDH-mCherry before (solid line) and after reduction with 20 μM NADH (dashed line; see Methods) exciting into the flavin excitation envelope (456 nm; green curves) or into the mCherry chromophore using 520 nm light (red curves).
