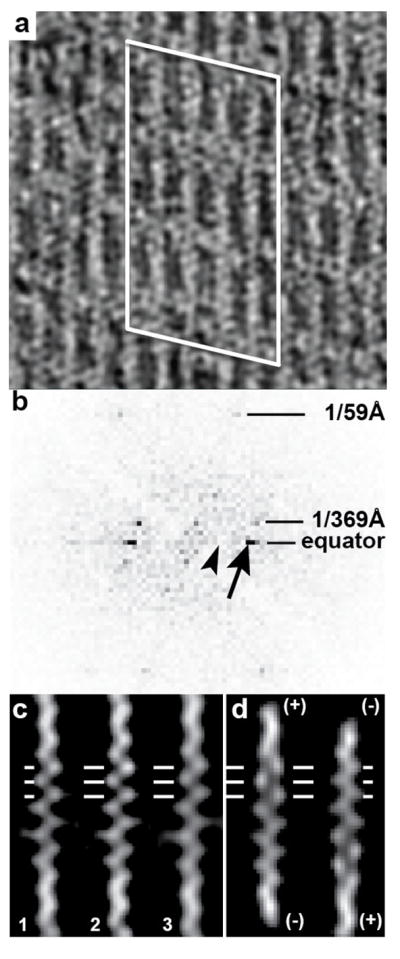
Figure 4.

Polarity of F-actin-aldolase rafts. (a) Projection image of a region of the tomogram. Actin subunits are well resolved as are the crosslinks. The white lines outline the region from which the Fourier transform in (b) has been calculated. (b) Computed transform of the region shown in (a). The arrow points to the strong equatorial spot that arises from the interfilament spacing, 1/(12 nm). The arrowhead points to the expected location of a row line that would be present if the filaments were arranged antiparallel, 1/(24 nm). The lack of any off-equatorial diffraction in this location indicates that the filaments are parallel, with a small axial offset giving the lattice its oblique character. (c) Single filament averages of three adjacent filaments, labeled 1, 2 and 3. Horizontal lines denote the positions of actin subunits. At this location in this filament orientation, each actin subunit appears as a distinct round density. (d) Projections of the model F-actin aligned to the filaments in (c) in two different orientations. Note that the left-hand orientation in (d) is a much better fit than the right-hand orientation.
