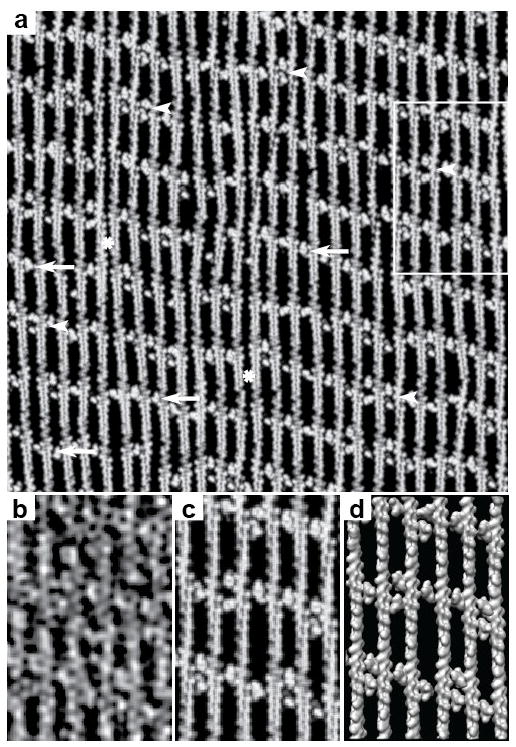
Figure 6.
Map backs. (a) Map back using actin and aldolase model densities of a complete tomogram. This is the same region of the tomogram shown in Figure 2 with the same points of interest identified. Arrows identify single cross-links, arrow heads identify double cross-links and the “*” identifies regions of a filament with no cross-linker. The square marks the region shown at higher magnification in panels (b–d). (b) A section taken from the right side of the raw tomogram shown in Figure 2. (c) Same area as (b) but a section from the map back using model densities. (d) The same as (c) but shown in surface view. Panels (b–d) all show the same area boxed in Figure 2.

