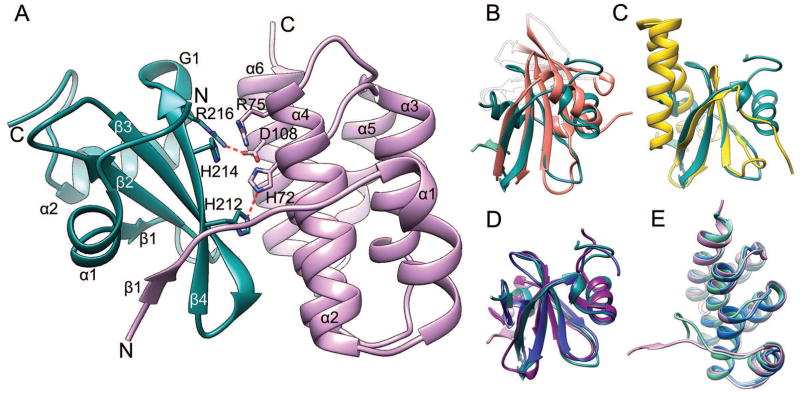
Figure 3. The CdiA-CT/CdiICtai complex.
(A) Experimental structure with the most conserved residues and their interactions shown in stick representation. The CdiA-CT toxin domain is shown in teal and the CdiI immunity protein in pink. Hydrogen bonds are depicted as red broken lines. Superposition of CdiA-CT with (B) the closest PDB homolog, inorganic triphosphatase (coral, PDB:3TYP), (C) with ParE toxin from E. coli (yellow, PDB:3KXE) and (D) with model T0884TS183_1 (purple) and refined model TR884TS118_1 (blue). The strand β1 from CdiI is shown for reference. (E) Superposition of CdiI with model T0885TS005_2 (cyan) and refined model TR885TS247_1 (blue).

