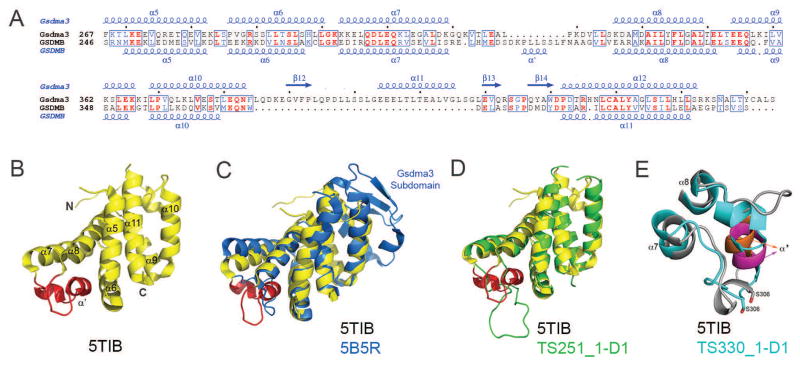
Figure 5.
(A) Structure-based sequence alignment of the GSDMB (T0948 comprises GSDMB’s C-terminal domain) and mouse Gsdma3 C-terminal domains with secondary structure elements shown above or below the respective sequences. Identical and conservatively replaced residues are colored in red and blue. The alignment was performed using the programs Clustal Omega 118 and ESPript 3 (espript.ibcp.fr/Espript/). (B) Ribbon diagram of the GSDMB_C fold (PDB 5TIB). The α7–α8 GSDMB loop containing the polymorphism residues is colored in red. (C) Superposition of the experimental GSDMB_C structure (colored yellow) and the corresponding Gsdma3 domain that served as a modeling template (blue, 5B5R), (D) Superposition of the experimental GSDMB_C structure (colored yellow) and the best GTD_TS CASP12 scored model of group 251 (green). (E) Superposition of the polymorphism loop of the experimental structure (colored gray with α′ highlighted in orange) with the corresponding loop assessed as the closest (Group 330) based on the position specific criterion (colored cyan with α′ highlighted in magenta).

