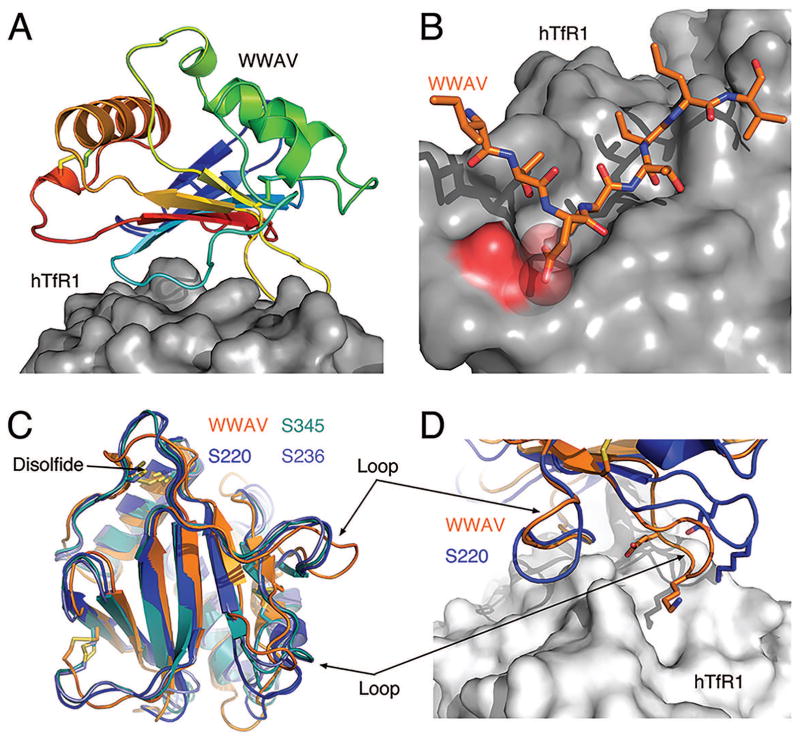
Figure 6. The structure of WWAV-GP1 compared to the top three models.
(A): Ribbon diagrams of the WWAV-GP1 colored in rainbow and shown in a putative complex with hTfR1 (surface representation) (PDB ID: 3KAS). (B): A potential charge-repulsion between two negatively charged groups on WWAV and hTfR1 that was identified using this analysis. (C): Comparison of the top three models from ‘MULTICOM-construct’, ‘MULTICOM-novel’, and ‘GOAL’ (designated S236, S345, and S220, respectively) with WWAV-GP1. (D): A close-up view comparing the loops of WWAV-GP1 that interact with hTfR1 to the top model. Structures were rendered using PyMOL (www.pymol.org).

