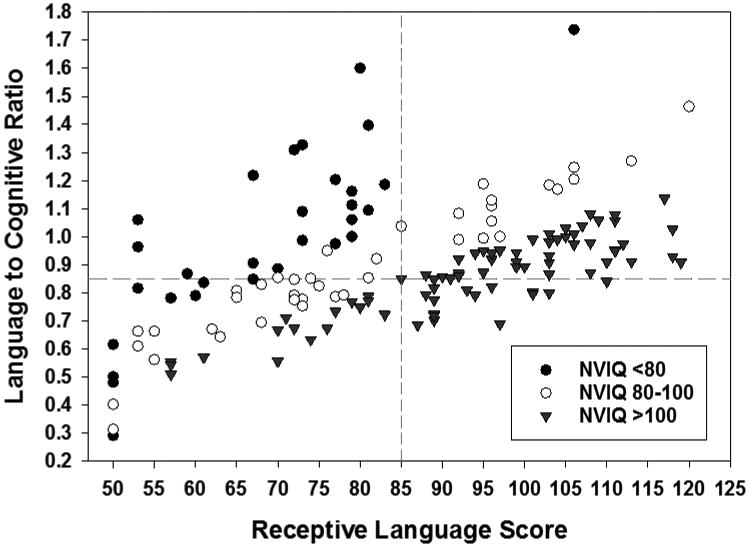
Figure 1.

Scatter plot, by nonverbal IQ (NVIQ) categories of the receptive standard language score on the Preschool Language Scale-5th edition on the x-axis with the ratio of the language score to the nonverbal IQ on the y-axis. The vertical dashed line (at 85 on the x-axis) represents 1 standard deviation below the population mean of 100. The horizontal dashed line (at 0.85 on the y-axis) represents the cutpoint used to define language underperformance. Lower ratio values indicate a lower language scores relative to nonverbal IQ score.
