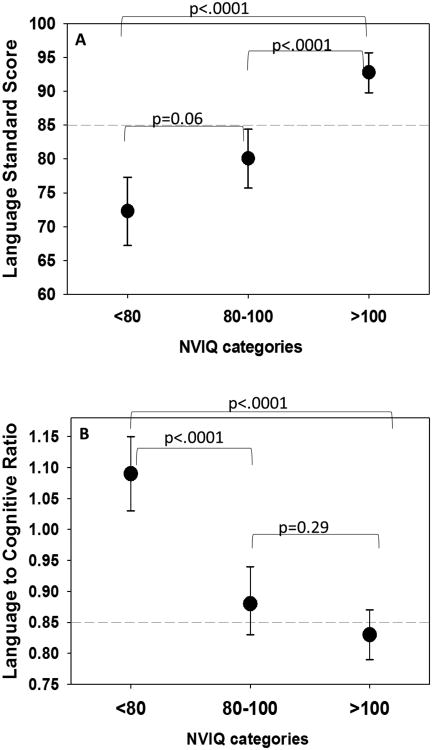
Figure 2.
Adjusted mean language standard scores (Panel A) and language ratio values (Panel B) by nonverbal IQ (NVIQ) categories. Adjusted least square means reported from general linear models after controlling for SES, unaided PTA, aided thresholds, age, and duration with device. P-values reported were adjusted for multiple comparisons using Tukey-Kramer method. Horizontal dashed lines indicate 1 standard deviation below the population mean (Panel A) and cut off for language underperformance (Panel B).

