
Figure 4.
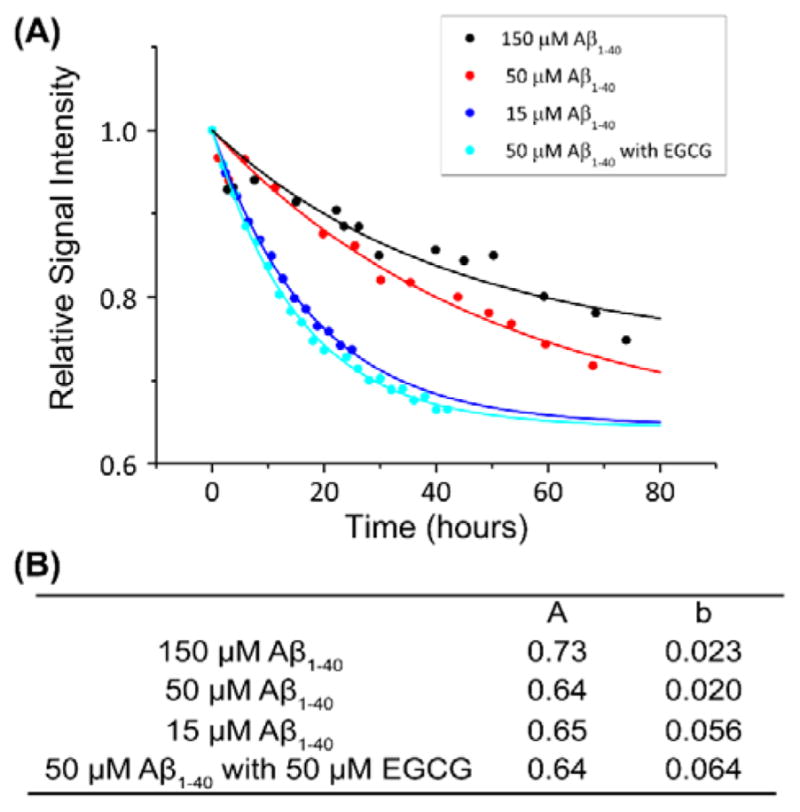
Concentration dependent monomer decay for Aβ40. (A) Aggregation kinetics of Aβ1–40 measured from 1H NMR signal intensity of methyl resonance (0.78 ppm) under 5 kHz MAS for various peptide concentrations. The monomer decay curve was fitted using the equation, y=(1−A)*exp(−b*x)+A. The parameters used for the monomer decay curves are given in (B). Additional experimental results on the changes in the peak intensities are shown in Figures S8 and S9 and Table S1.