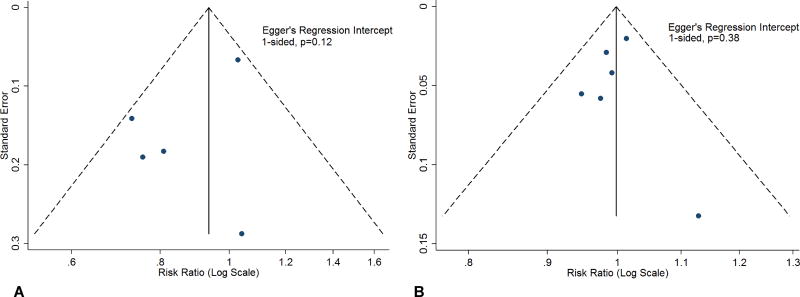
Figure 4.
Panel A: Depiction of Publication Bias For the All-Cause Mortality Comparison Between Hypothermia and Normothermia.
Panel B: Depiction of Publication Bias For The All-Cause Mortality Comparison Between Pre-Hospital Hypothermia and In-Hospital Hypothermia.
Blue circles represent available studies. The dashed lines indicated the triangular region with pseudo 95% confidence interval. The Egger’s regression intercept for funnel plot was non-significant (Panel A, 1-sided, p=0.12 and Panel B, 1-sided, p=0.38).
CI: Confidence interval; HT: Hypothermia; IH: In-hospital hypothermia; NH: Normothermia; PH: Pre-hospital hypothermia; RR: Risk ratio.

