
FIGURE 4.
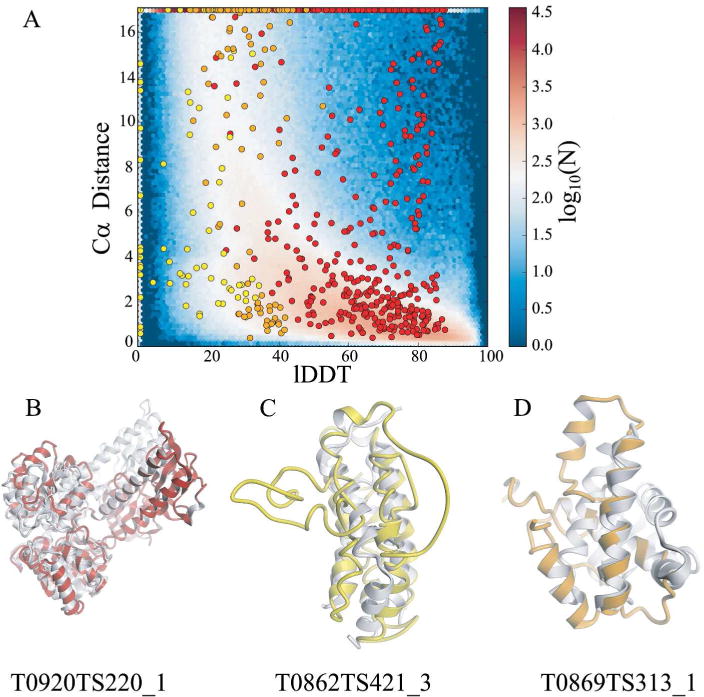
Illustration of the limitations of superposition based Cα distances in estimating model accuracy prediction. Panel A - Cα distances are compared to the corresponding local lDDT values for three exemplary quality predictions from CASP12. Cases of high Cα deviations contrasting high quality assigned by the all-atom lDDT values are indicated as red data points at the top right of the graph, and short Cα distances that contrast with low lDDT values are indicated as yellow and orange data points in the lower left area of the plot. The following examples illustrate reasons for these discrepancies: Panel B - the underlying global superposition fails for large domain movements and multi-domain proteins (red circles in panel A). Panel C – 90% of the atomic interactions are missing by focusing on Cα atoms, limiting in particular the assessment of high quality models. Panel D - evaluation of residue neighborhoods are implicitly excluded when considering Cα atoms only. lDDT assigns low scores to residues with large stereochemical deviations and physically impossible close contacts (e.g. yellow data points at lDDT value of 0.0, translating to unphysically positioned backbone and side chain atoms. The background image in panel A represents the data for all QE-stage2 submissions in CASP12.