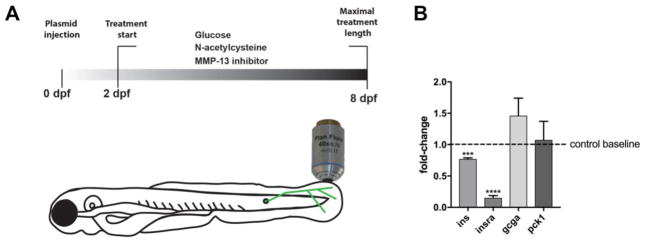
Figure 1. Glucose treatment influences glucose metabolism in larval zebrafish.
(a) Treatment scheme of larval zebrafish. Treatments with glucose were performed between 2 and 8dpf for lengths indicated in the text. Larvae either remained untreated or 40mM glucose was added to the media, followed by confocal imaging of GFP-expressing sensory axons innervating the caudal fin. Additional treatments were performed with N-acetylcysteine and MMP-13 inhibitor, DB04760.
(b) Quantitative PCR shows downregulation of ins and insra in animals treated with 40mM glucose for 6 days compared to untreated controls (dotted line depicts control baseline levels; pools of ~20–30 larvae were used per group in 2 biological replicates). ins and insra expression is significantly reduced but gcga and pck1 expression does not significantly change.
Student’s t-test was used for comparisons of each group to the untreated control group. The standard error of the mean is shown for all bars. ****p<0.001, p****<0.0001, ns= not significant
Abbreviations: dpf: days post fertilization, ins: insulin, insra: insulin receptor, gcga: glucagon a, pck1: phosphoenolpyruvate carboxykinase 1

