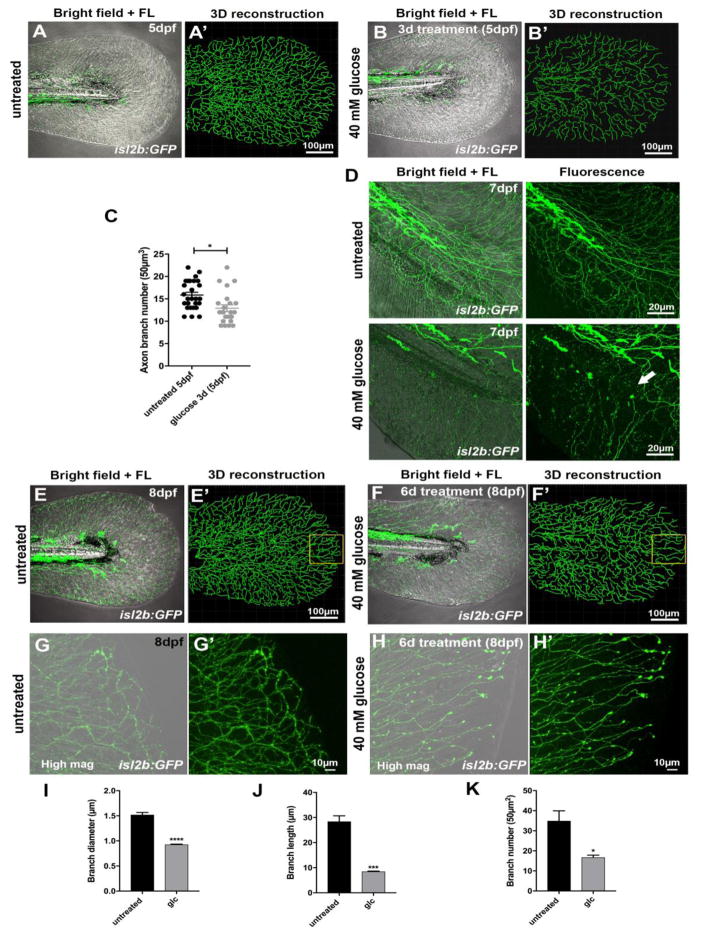
Figure 2. Glucose treatment induces neurotoxicity.
(a, a′) Caudal fin of a transgenic Tg(isl2b:GFP) zebrafish larva at 5dpf (a, merged bright field and fluorescence images) and 3D reconstruction of GFP-labeled sensory axons using Imaris (Bitplane) software (a′).
(b, b′) Caudal fin of an isl2b:GFP transgenic fish at 5dpf (b, merged bright field and fluorescence images) treated with 40mM glucose for 3 days. 3D reconstruction (b′) of GFP-labeled sensory axons shows reduced axon branch numbers compared with untreated controls (a′) at 5dpf.
(c) Quantification of (a, b) shows a significant reduction in axon branch number following glucose treatment compared with untreated controls (n=3 biological replicates, ≥5 animals each).
(d) Caudal fin of Tg(isl2b:GFP) zebrafish larvae at 7dpf either untreated (upper panels) or after treatment with glucose (lower panels) for 5 days. Sensory axon debris is visible after glucose treatment (arrow).
(e, f) Caudal fin of untreated Tg(isl2b:GFP) larva (e, e′) and larva treated with 40mM glucose for 6 days (2–8dpf) (f, f′). Left panels show merged bright field images. Right panels in each figure show 3D reconstructions of GFP-labeled sensory axons. The yellow box depicts decreased axon branches, which are most evident in the distal caudal fin following glucose treatment.
(g, h) High magnification images of sensory axons in the distal caudal fin of untreated control
(g, g′) and glucose-treated fish (h, h′), the latter showing fewer axon branches.
(i–k) Quantification of axon branch diameter (i), branch length (j), and branch number (k) in a 50μm2 region of the medial distal caudal fin (yellow box in e′, f′) compared between untreated control and glucose-treated fish at 8dpf.
Student’s t-test was used for comparing the treatment groups to the respective untreated control group. The standard error of the mean is shown in each graph. *p<0.05, ***p<0.001, p****<0.0001
Abbreviations: d: days, dpf: days post fertilization, FL: fluorescence, glc: glucose, mag: magnification

