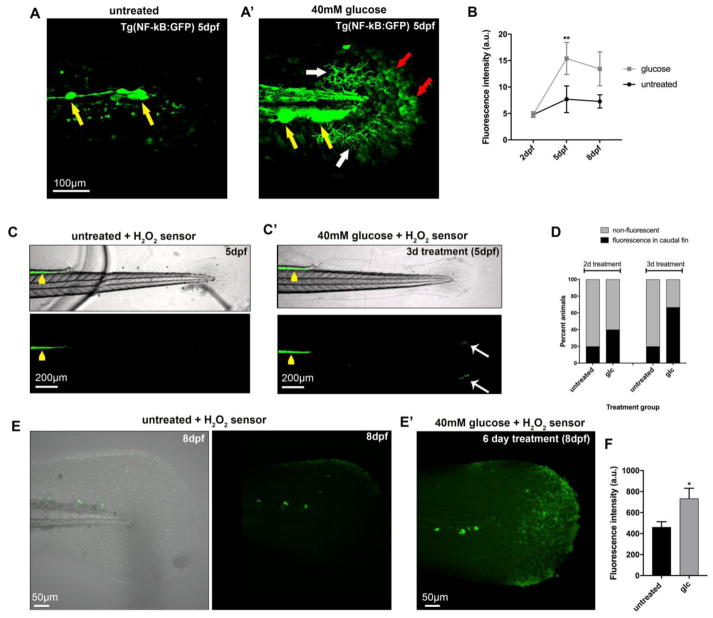
Figure 3. Increased oxidative stress and NF-κB activity in the caudal fin after glucose treatment.
(a, a′) Control (a) and glucose-treated (a′) transgenic Tg(NF-κB:GFP) larvae at 5dpf display fluorescence in the lateral line neuromasts (yellow arrows). Additional fluorescence can be observed after 3 days of glucose treatment in mesenchymal cells (white arrows, a′) and keratinocytes (red arrows, a′).
(B) Fluorescence intensity measurements in keratinocytes of the distal caudal fin in untreated and glucose-treated (40mM) Tg(NF-κB:GFP) fish at 2dpf (before treatment), 5dpf (3-day treatment), and 8dpf (6-day treatment) reveals increased NF-κB activity in the glucose-treated group (n=5 animals per group using identical imaging settings).
(c, c′) Zebrafish larvae at 5dpf treated with the chemical H2O2-selective sensor pentafluorobenzene sulfonyl-fluorescein 2hr prior to imaging show increased oxidation (green fluorescence) in the intestinal tract (yellow arrowheads). The glucose-treated larva (c′) displays additional fluorescence in the distal caudal fin (white arrows), indicative of skin injury (compare with bright field image).
(d) Quantification of the percentage of animals with fluorescence in the distal fin as shown in (c, c′) reveals that more animals fluoresce following glucose treatment (5 animals per group imaged with identical settings).
(e, e′) Shown is the caudal fin of an untreated (e) and glucose-treated (e′) zebrafish larva at 8dpf in which H2O2 is detected with pentafluorobenzene sulfonyl-fluorescein. Increased H2O2 levels are detected after 6 days of glucose treatment.
(f) Quantification of H2O2 fluorescence as shown in (e) reveals increased levels in the glucose-treated group compared with untreated control animals (6 animals per group imaged under identical conditions).
One-Way ANOVA with Tukey’s multiple comparisons test (b) and Student’s t-test (f) was used to compare the treatment groups with the respective untreated control group. Standard errors of the mean are shown. *p<0.05, **p<0.01
Abbreviations: a.u.: arbitrary units, dpf: days post fertilization, glc: glucose

