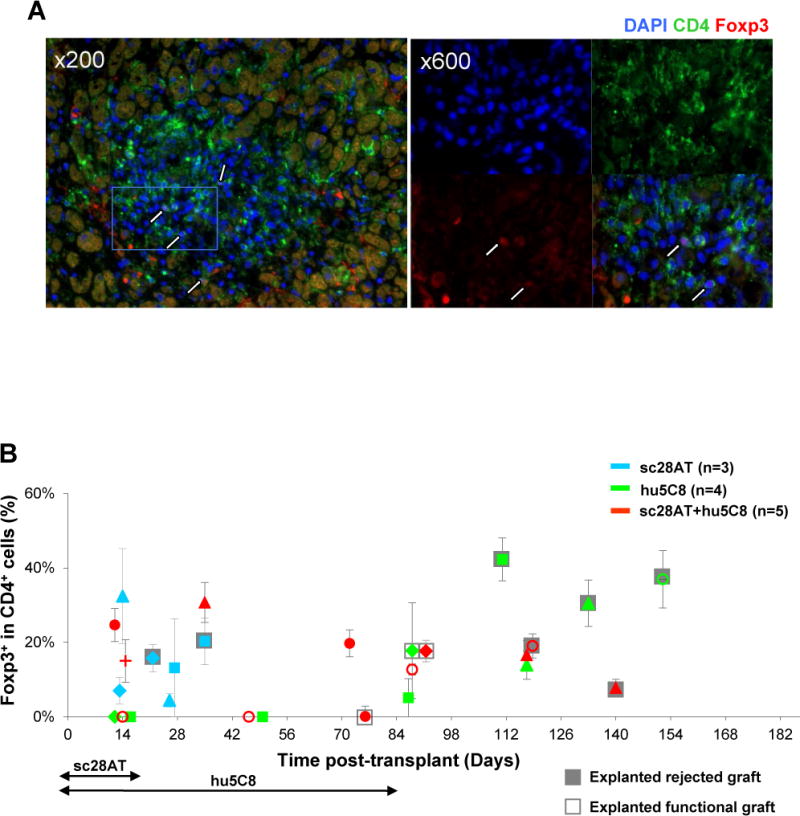
Figure 5. Immunofluorescent staining of graft infiltrating CD4+Foxp3+ T cells.

(A) Representative pictures of a cardiac allograft from sc28AT+hu5C8 group (MC9025, d118). Blue, DAPI nuclear staining; green, CD4; red, Foxp3. Several putative Tregs are identified by nuclear staining of Foxp3 surrounded by CD4 staining (white arrows). Original magnification, ×200 (left), × 600 (right). The right panel represents a magnification of the white rectangle indicated in the left panel. (B) Percentages of Foxp3+ cells among CD4+ lymphocytes in graft biopsies and functional (open boxes) or rejected (grey boxes) explanted cardiac allografts. Each dot represents the mean ± SEM of 2~7 fields from the same tissue specimen.
