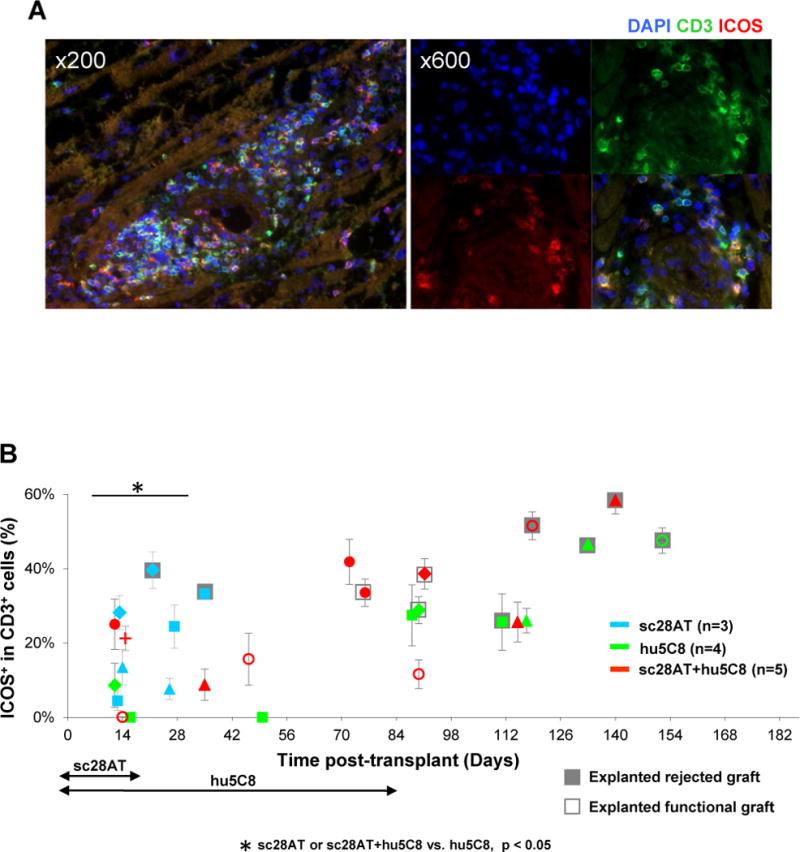
Figure 6. Immunofluorescent staining of intra-graft CD3+ICOS+ T cells.

(A) Representative pictures of a cardiac allograft from sc28AT+hu5C8 group (MC9025, d118). Blue, DAPI nuclear staining; green, CD3; red, ICOS. A majority of CD3+ T cells express ICOS in this rejected allograft. (B) Percentages of ICOS+ cells among CD3+ cells in biopsies and explanted cardiac allografts. Each dot represents the mean±SEM of 2~7 fields from the same tissue specimen. *P<0.05 for the comparisons indicated.
