Objectives
The intensive care unit (ICU) is a complex environment in terms of data density and alerts, with alert fatigue, a recognized barrier to patient safety. The Electronic Health Record (EHR) is a major source of these alerts. Although studies have looked at the incidence and impact of active EHR alerts, little research has studied the impact of passive data alerts on patient safety.
Method
We reviewed the EHR database of 100 consecutive ICU patient records; within, we assessed the number of values flagged as either as abnormal or “panic” across all data domains. We used data from our previous studies to determine the 10 most commonly visited screens while preparing for rounds to determine the total number of times, an abnormal value would be expected to be viewed.
Results
There were 64.1 passive alerts/patient per day, of which only 4.5% were panic values. When accounting for the commonly used EHR screens by providers, this was increased to 165.3 patient/d. Laboratory values comprised 71% of alerts, with the remaining occurring in vitals (25%) and medications (6%). Despite the high prevalence of alerts, certain domains including ventilator settings (0.04 flags/d) were rarely flagged.
Conclusions
The average ICU patient generates a large number of passive alerts daily, many of which may be clinically irrelevant. Issues with EHR design and use likely further magnify this problem. Our results establish the need for additional studies to understand how a high burden of passive alerts impact clinical decision making and how to design passive alerts to optimize their clinical utility.
Key Words: alert, electronic health record, ICU, simulation
Both alarm and alert fatigue are increasingly recognized patient safety issue in the intensive care unit (ICU).1,2 With increasing number of alerts, clinicians often become “desensitized” to them. This results in alarms either being ignored or inappropriately silenced with subsequent patient harm. Consequently, excessive alarms have been identified as a “top 10” technology hazard.2 In response to these concerns, reducing inappropriate alarms and alerts was designated as a national patient safety goal in 2014 with further regulations anticipated in the ensuing years.3
While the vast majority of studies in the ICU have focused on audible alerts (from monitors and ventilators), the Electronic Health Record (EHR) is also a potential major source of alerts, which can contribute to cognitive overload. One class of EHR alerts is active or “pop-up” warnings such as those generated with potential medication interactions with Computerized Provider Order Entry. These require an act by the end user to overcome and for clinical workflow to continue, for example, closing a window or clicking on a button. The other classes of alerts are passive, such as the highlighting of potential abnormal values. In contrast to active alerts, these do not be actively acknowledged by the end user to continue with clinical workflow.
A number of studies have already documented the problem of EHR alert fatigue with active alerts in the ICU. Studies of Computerized Provider Order Entry suggest that between 52% and 98% of medications alerts are overridden.4,5 Similar results have been obtained with the use of clinical decision support tools in the ICU. In 1 study, although only 2.3 alerts were generated per patient per admission, only 41% of these were acknowledged and acted upon.6 In a multicenter survey of Veterans Affairs providers, the average providers stated that they were exposed to 69 alerts/d. Furthermore, 87% stated that the number of alerts was excessive, and almost 70% indicated that they received more alerts than they could handle.7
Passive EHR alerts may also represent an important source of alert fatigue in the ICU. The sheer volume of data points generated on each ICU patient daily (>2000 in the most critically ill) and the abnormal physiology of the critically ill create potential for a large number of passive alerts.8 This is most apparent with laboratory values. Most EHRs determine the “normal” range for laboratory values on the basis of healthy adults.9 However, many values, which are considered “abnormal” for healthy individuals, may indeed be normal or acceptable for ICU patients, generating a large number of passive alerts, which would be deemed as “false positives” by the average clinician.10
This issue is further compounded by the fact that the average clinician may use a number of different screens in the EHR while reviewing patient data, with certain data elements being duplicated on many of these screens. In our previous study, we documented that when reviewing a patient chart for rounds, physicians visit on average 18 different screens with many data elements and thus alerts, being replicated on many of these screens.11 Therefore, although the potential for passive EHR alerts in the ICU is high for the reasons mentioned, the true burden of these alerts has never been quantified. Therefore, the goals of this study are to describe the total number of passive alerts generated daily for an ICU patient and to determine which data domains are most and least likely to generate alerts. We would then use previous usability data to determine the total number of alerts that the average provider would be expected to be exposed to during standard clinical workflow.
METHODS
As part of a study investigating data veracity during ICU presentations, 100 consecutive medical ICU charts were investigated; the EHR used for clinical care was Epic Care 2012 (EPIC Systems, Madison, Wis). The total number of passive alerts was calculated for the previous 24 hours, and data classified as either vital signs, medication related, laboratory test values, or ventilator related. We specifically designated whether alerts were “standard” (highlighted in red font) or represented “panic values” (highlighted in red and a red exclamation point) as represented by our EHR.
For each data element (e.g., sodium), we determined a “multiplier” factor to represent the number of areas that a potential clinician would view the value during a standard data during preparation for daily rounds. The multiplier was determined from our previous studies employing screen and eye tracking into an EHR simulation exercise where house staff were instructed to review a chart and prepare for rounds.11 For analysis, we included the top 10 most frequently visited screens, all of which were used by more than 50% of subjects. We then calculated, for each data element, the number of times each element would be represented on those 10 screens to determine the true alert burden for each element. The study was approved by the Oregon Health and Science University institutional review board.
RESULTS
The general clinical characteristic of the patients can be found in Table 1. Overall, the mean patient generated 64.1 alerts/d with a range of 17 to 249 (Fig. 1). However, taking into account the multiplier for each data element, this increased to a mean of 165.3 alerts/d with a range of 41 to 615. Interestingly, only a small fraction of these were considered panic alerts, with a mean of 2.9 panic values per patient, representing 4.5% of the total number of alerts.
TABLE 1.
Clinical Characteristics of Study Patients
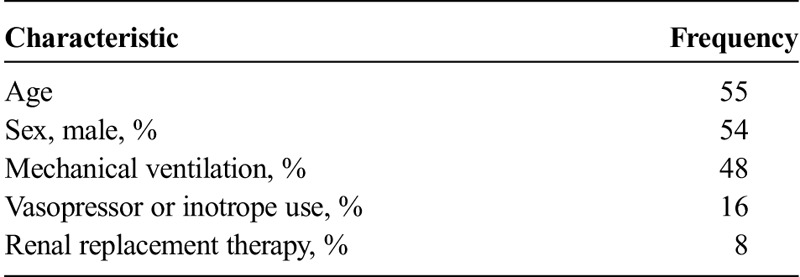
FIGURE 1.
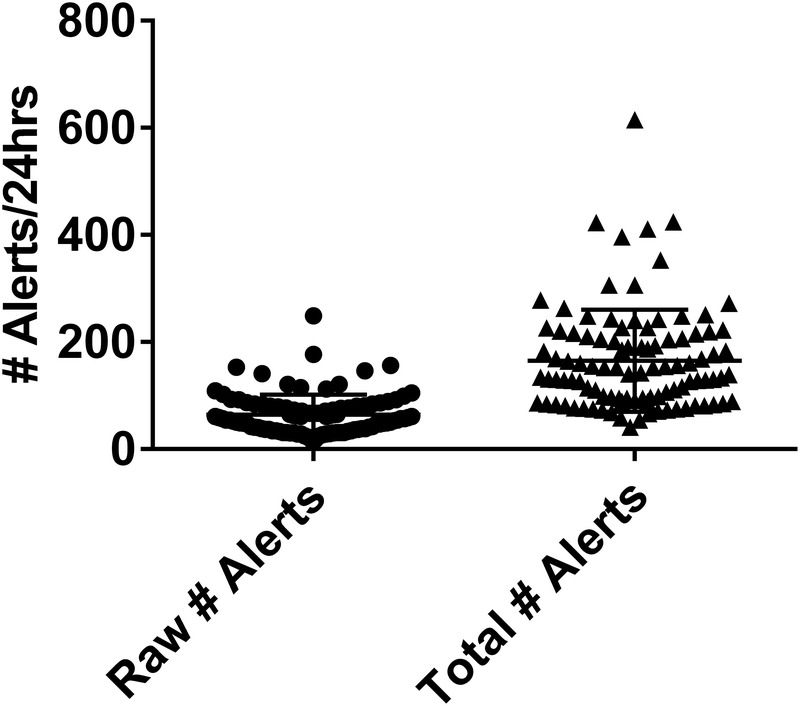
Raw and total number of passive EHR alerts: 100 charts were reviewed for the presence of alerts for a 24-hour period. The mean number of alerts (raw) is presented on the left. The total number of alerts (right) accounts for number of times that each alert would be expected to be viewed during routine chart review on the basis of objective EHR use assessments in simulated exercises.
Looking at the frequency of alerts across domains, laboratory values were most likely to generate alerts (representing 71% of the total alerts), followed by vitals (29%) and passive medication alerts (6%, Fig. 2A). When we accounted for the multiplier for each individual test, a similar trend was observed for the total number of alerts (Fig. 2B). Interestingly, despite 48% of subjects being on mechanical ventilation, only 8 total alerts were recorded for any ventilator parameters, with some parameters never flagged as abnormal. For example, 23% of ventilated patients had a documented plateau pressure of less than 30 mm Hg, the established safe upper limit for patients with lung disease, with values ranging up to 49 mm Hg with none of the values flagged as abnormal or critical.12
FIGURE 2.
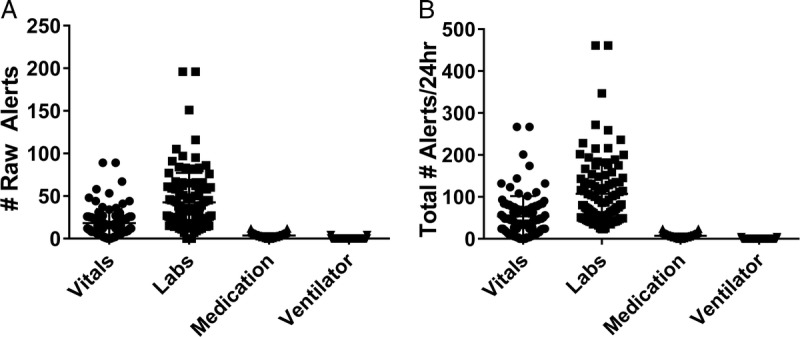
Number of raw and total alerts for each information domain. One hundred charts were reviewed for the presence of alerts for a 24-hour period. A, The mean number of alerts (raw) is presented (left) for each of the 4 major data domains assessed. B, The total number of alerts (right) accounts for number of times that each alert would be expected to be viewed for each data domain during routine chart review on the basis of objective EHR use assessments in simulated exercises.
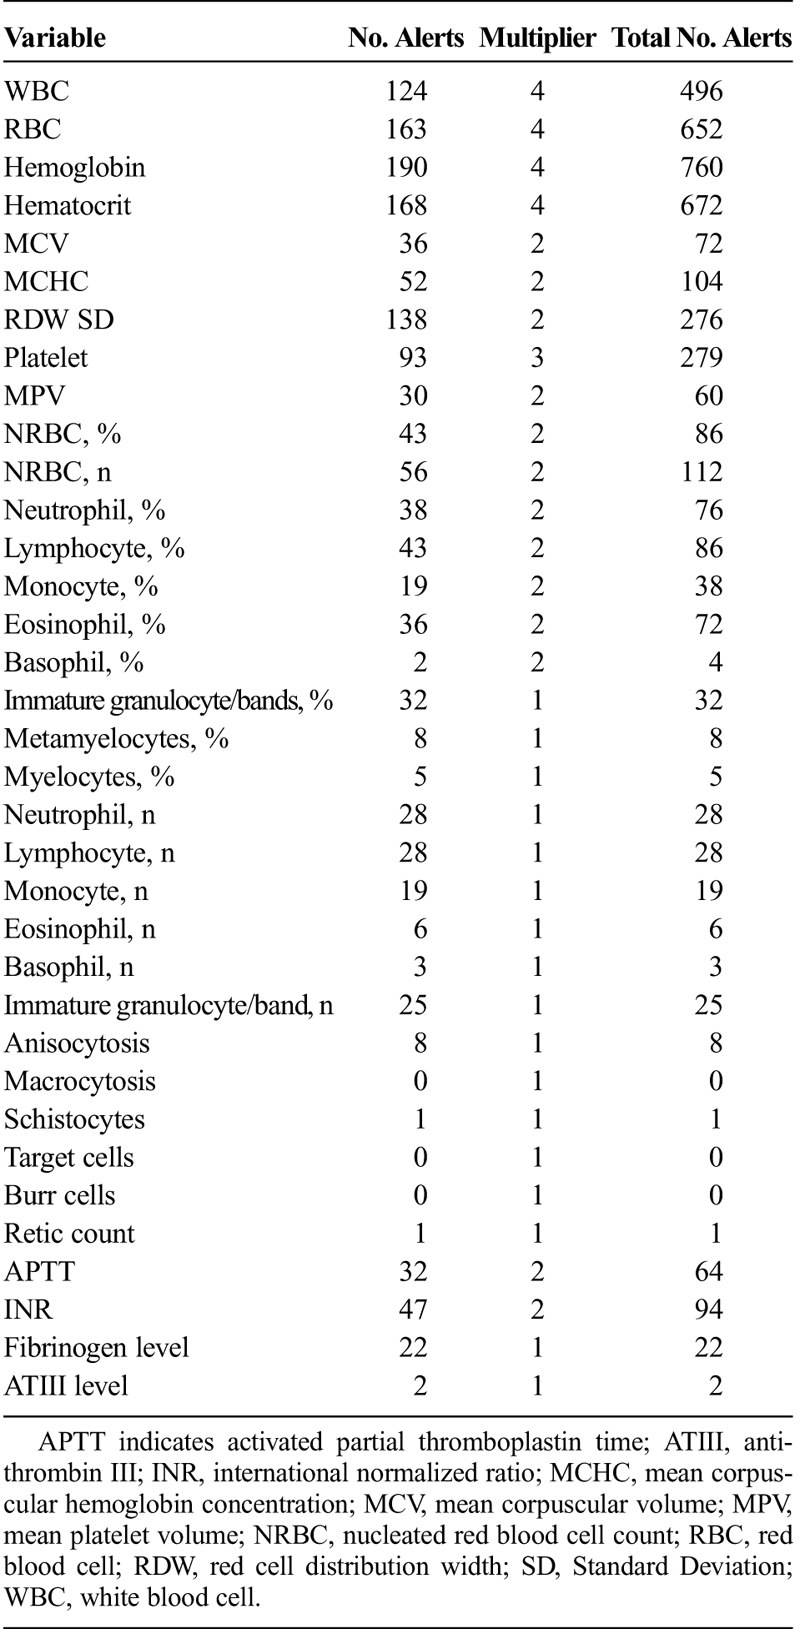
When looking at individual patient data values across all data domains, respiratory rate was the most commonly alerted parameter comprising 18% of the total alerts recorded. For laboratory values, hemoglobin was the most frequently alerted laboratory value. Furthermore, a large number of alerts were generated for data elements, which would be considered of limited value in the management of the critically ill, such as the mean platelet volume or red cell distribution width. A complete list of all of the variables across all of the data domains, alert number, and multipliers are found in Tables 2 to 5.
TABLE 2.
List of Variables in Vitals Signs and Number of Alerts
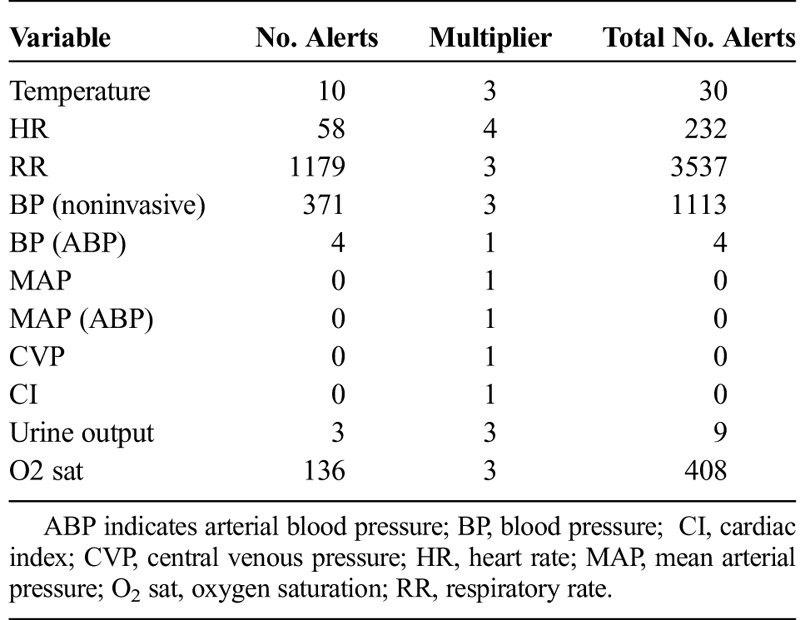
TABLE 5.
List of Chemistry Variables and Number of Alerts

TABLE 3.
List of Ventilator Variables and Number of Alerts
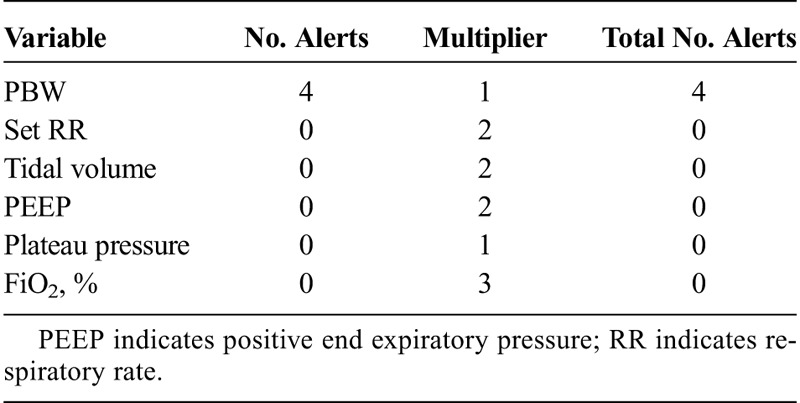
TABLE 4.
List of Hematology Variables and Number of Alerts
DISCUSSION
The most important finding in this study was providing an estimate of the total number of passive alerts that the average ICU patient generates per day. The sheer volume of passive EHR alerts generated per patient is immense. Given a current recommended safe maximum ICU census of 14 patients/attending, our data suggest that the average clinician would be subjected to as many as 897 alerts/ICU patient day.13,14 Assuming a mean ICU length of stay of 3 days, this would generate nearly 2700 passive alerts to be processed during daily review of data. When accounting for the number of screens, the average provider would be expected to use while preparing for rounds that the total exposure would be almost 3-fold higher than this, with an average clinician potentially exposed to nearly 7000 passive alerts/d.
When looking at the distribution of the alerts, 3 trends became apparent. First, only a small fraction of the alerts represented true “panic” values. Second, a large number of alerts were generated in data domains rarely used in the day-to-day management of ICU patients by clinicians. Finally and perhaps more importantly, certain data domains never contained alerts, not because of the presence of abnormal values but rather the failure to program alert thresholds to fire alerts for specific values even though they were clinically significant. This is highlighted by a significant fraction of our patients having plateau pressure of greater than 30 mm Hg, the established threshold for ensuring application of lung-protective ventilation and mitigation of ventilator-associated lung injury.12 Thus, the average clinician must deal with both the inappropriate presence as well as the inappropriate absence of alerts. This almost certainly contributes to alert fatigue and decreases the impact and effectiveness of the said alerts.
The results of our study highlight the potential of customizable EHR alert thresholds for data domains specific in EHR users' clinical environments. In 1 study, Kilickaya et al10 documented that through creation of custom laboratory alert thresholds in the ICU, the number of false-positive alerts could be reduced by 38%. Our data suggest that laboratory values represent only a fraction of these alerts and that similar work will be required to design customized alerts for all data domains.
On the other hand, it is currently unclear what unintended consequences, if any, customized data alerts would create. The impact on clinician decision making and cognitive load is unknown. It will be imperative to ensure that reducing the “sensitivity” of alerts does not generate additional false negatives. In addition, despite a goal of reducing overall clinician alert burden, our findings suggest that certain currently underrepresented domains, such as ventilator data, may actually generate an increase number of alerts with threshold customization, thus potentially negating any benefits obtained by reducing alerts in other domains.
Our data also highlight the importance of not only understanding the frequency of an abnormal value but also the true frequency at which a clinician would be expected to be exposed to said alerts (multiplier). The determination of these multipliers for each individual value is likely highly variable for each individual EHR and each clinician type. This problem of data fragmentation, as well as data being duplicated on multiple screens, termed “overcompleteness,” has both been identified a safety issue induced by current EHR workflow.15 Although it is not feasible to know the number of screens that each individual provider uses for each patient, the use of our controlled simulations allows for identification of the most commonly used screens. By harnessing data from our previous studies incorporating screen tracking into a high-fidelity ICU data gathering simulation, we were able to understand the typical workflow that the average clinician embarks on while reviewing data in preparation for rounds.11 For this study, we included the top 10 screens used, all of which used by at least 50% of individuals for determination of the multiplier and had almost a 4-fold increase on the number of passive alerts that the clinician would be subjected. However, given that our previous studies documented over 125 different screens used by our clinicians and many screens were visited multiple times during data gathering, a true “worst-case” scenario for a multiplier effect would be much higher and beyond the scope of the current study.
Our study does have a number of limitations. First, this was performed in a single institution and with a single EHR; there may be significant intra- and inter-EHR variances in both the established alert thresholds and the degree of data fragmentation to determine the multiplier. Second, this study, though describing a large number of alerts, does not determine the extent to which these alerts are either ignored and/or contribute to alert fatigue/cognitive overload. This will be the focus of future simulation-based exercises. Third, our multiplier was determined using the averaged performance of house staff during chart review. This does not take into account the number of times a screen is revisited during preparation for rounds, a common phenomenon observed in our previous work. Furthermore, these multipliers would have to be established for each professional group (nurses, pharmacists, respiratory therapists) because it is well established that each group not only can have customized interfaces within the EHR but likely will have different workflow and usability patterns within that interface as well.
CONCLUSIONS
There is an extremely high frequency of passive alerts generated daily in the ICU, a fact compounded by the number of places, which the average clinician visits in the EHR during routine patient care. Improving the thresholds to ensure both the absence and presence of appropriate alerts across all data domains needs to be a continued focus of future EHR design by vendors. It will be important that changes reflect a partnership between vendors, end users, and medical legal experts to acknowledge the potential impacts these changes may have on design, cost, workflow, and medical liability.16 More importantly, it will be essential that developers of EHRs and their associated applications study the impact of such changes studied in objective, controlled, environments to determine their impact on cognitive load alert fatigue and clinical decision making.
Footnotes
The authors disclose no conflict of interest.
Supported by AHRQ R18 HS021367 and AHRQ R01 HS23793.
REFERENCES
- 1.Drew BJ, Harris P, Zegre-Hemsey JK, et al. Insights into the problem of alarm fatigue with physiologic monitor devices: a comprehensive observational study of consecutive intensive care unit patients. PLoS One. 2014;9:e110274. [DOI] [PMC free article] [PubMed] [Google Scholar]
- 2.Keller JP., Jr Clinical alarm hazards: a “top ten” health technology safety concern. J Electrocardiol. 2012;45:588–591. [DOI] [PubMed] [Google Scholar]
- 3.Commission TJ. The Joint Commission announces 2014 National Patient Safety Goal. In: Commission TJ, ed. Available at: http://www.jointcommission.org/assets/1/18/JCP0713_Announce_New_NSPG.pdf. Accessed on November 15, 2015. [PubMed]
- 4.van der Sijs H, Mulder A, van Gelder T, et al. Drug safety alert generation and overriding in a large Dutch university medical centre. Pharmacoepidemiol Drug Saf. 2009;18:941–947. [DOI] [PubMed] [Google Scholar]
- 5.Lin CP, Payne TH, Nichol WP, et al. Evaluating clinical decision support systems: monitoring CPOE order check override rates in the Department of Veterans Affairs' Computerized Patient Record System. J Am Med Inform Assoc. 2008;15:620–626. [DOI] [PMC free article] [PubMed] [Google Scholar]
- 6.Scheepers-Hoeks AM, Grouls RJ, Neef C, et al. Physicians' responses to clinical decision support on an intensive care unit–comparison of four different alerting methods. Artif Intell Med. 2013;59:33–38. [DOI] [PubMed] [Google Scholar]
- 7.Singh H, Spitzmueller C, Petersen NJ, et al. Information overload and missed test results in electronic health record-based settings. JAMA Intern Med. 2013;173:702–704. [DOI] [PMC free article] [PubMed] [Google Scholar]
- 8.Manor-Shulman O, Beyene J, Frndova H, et al. Quantifying the volume of documented clinical information in critical illness. J Crit Care. 2008;23:245–250. [DOI] [PubMed] [Google Scholar]
- 9.Carlsson L, Lind L, Larsson A. Reference values for 27 clinical chemistry tests in 70-year-old males and females. Gerontology. 2010;56:259–265. [DOI] [PubMed] [Google Scholar]
- 10.Kilickaya O, Schmickl C, Ahmed A, et al. Customized reference ranges for laboratory values decrease false positive alerts in intensive care unit patients. PLoS One. 2014;9:e107930. [DOI] [PMC free article] [PubMed] [Google Scholar]
- 11.Gold JA, Stephenson LE, Gorsuch A, et al. Feasibility of utilizing a commercial eye tracker to assess electronic health record use during patient simulation. Health Informatics J. 2016;22:744–57. [DOI] [PubMed] [Google Scholar]
- 12.Ventilation with lower tidal volumes as compared with traditional tidal volumes for acute lung injury and the acute respiratory distress syndrome. The Acute Respiratory Distress Syndrome Network. N Engl J Med. 2000;342:1301–1308. [DOI] [PubMed] [Google Scholar]
- 13.Ward NS, Afessa B, Kleinpell R, et al. Intensivist/patient ratios in closed ICUs: a statement from the Society of Critical Care Medicine Taskforce on ICU Staffing. Crit Care Med. 2013;41:638–645. [DOI] [PubMed] [Google Scholar]
- 14.Neuraz A, Guerin C, Payet C, et al. Patient Mortality Is Associated With Staff Resources and Workload in the ICU: a multicenter observational study. Crit Care Med. 2015;43:1587–1594. [DOI] [PubMed] [Google Scholar]
- 15.Ash JS, Berg M, Coiera E. Some unintended consequences of information technology in health care: the nature of patient care information system-related errors. J Am Med Inform Assoc. 2004;11:104–112. [DOI] [PMC free article] [PubMed] [Google Scholar]
- 16.Ridgely MS, Greenberg MD. Too many alerts, too much liability: sorting through the malpractice implications of drug-drug interaction clinical decision support. Saint Louis University Journal of Health Law & Policy. 2012;5:257–296. [Google Scholar]


