
FIGURE 2.
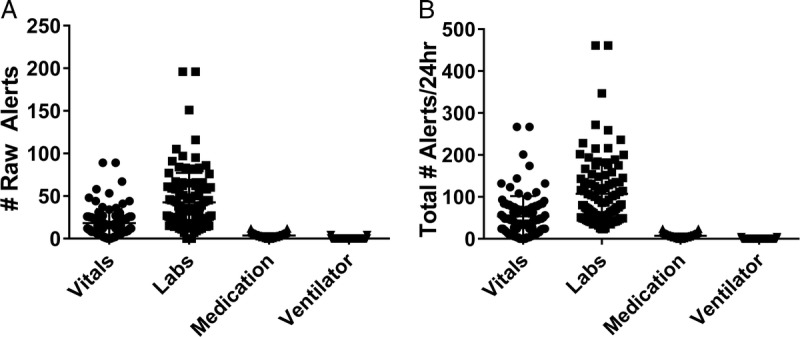
Number of raw and total alerts for each information domain. One hundred charts were reviewed for the presence of alerts for a 24-hour period. A, The mean number of alerts (raw) is presented (left) for each of the 4 major data domains assessed. B, The total number of alerts (right) accounts for number of times that each alert would be expected to be viewed for each data domain during routine chart review on the basis of objective EHR use assessments in simulated exercises.