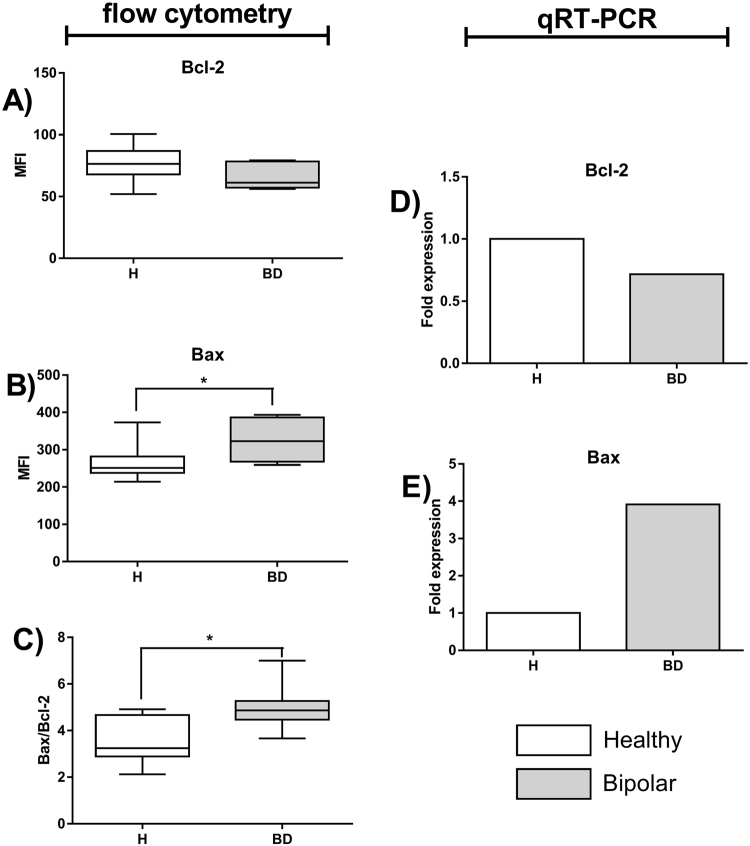
Figure 4.
Estimation of Bcl-2 and Bax expression in T lymphocytes. Figure A shows expression of Bcl-2 protein measured as mean fluorescence intensity (MFI), Figure B - expression of Bax protein and Figure C - Bax-Bcl-2 ratio in healthy people and BD patients. Center lines of figures present medians, boxes present 25th-75th percentiles and whiskers show the minimal and maximal values observed, Mann-Whitney test, *p < 0.05. Figure D and E respectively show fold change in BCL2 and BAX genes’ expression.

