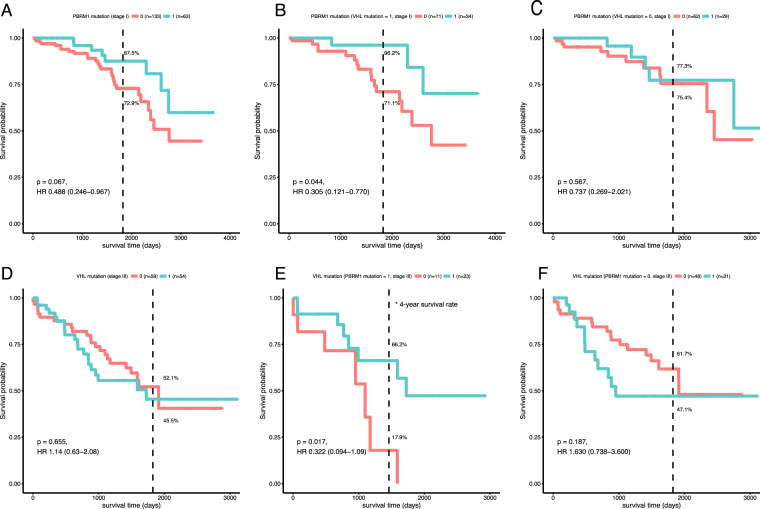
Figure 3.
Stage specific survival analysis. (A) Survival curve for PBRM1 mutations in stage I. (B) Survival curve for PBRM1 mutations with VHL mutations in stage I. (C) Survival curve for PBRM1 mutations without VHL mutations in stage I. (D) Survival curve for VHL mutations in stage III. (E) Survival curve for VHL mutations with PBRM1 mutations in stage III. (F) Survival curve for VHL mutations without PBRM1 mutations in stage III. Dash line represents the time point of 5 years.

