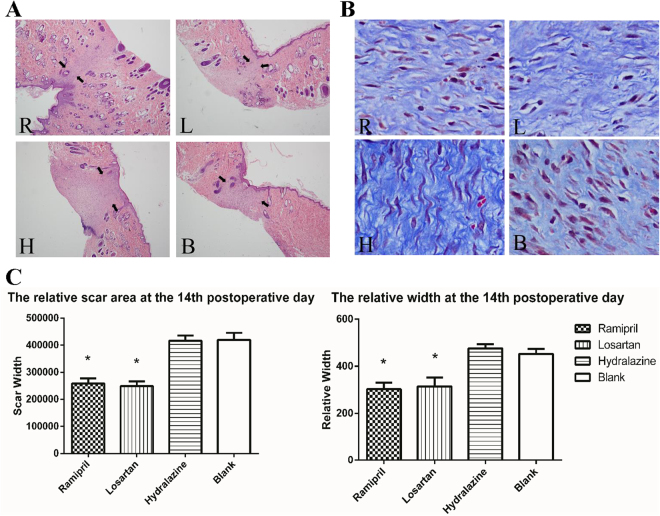
Figure 4.
ACEI inhibited fibrosis and scarring in a rat scar model. (A,B) Representative photomicrographs of scar tissue obtained on day 14 with H&E staining (A) or Masson staining (B). Black arrows (A) mark the scales of scars. R: ramipril group; L: losartan group; H: hydralazine group; B: blank control group. (C) Relative scar areas and relative widths in the four groups (n = 12 wounds in six rats in each group). *P < 0.05 compared with the blank control group. H&E staining; images were obtained 40× magnification with an Olympus CKX41SF inverted phase-contrast microscope. Areas were calculated with the Image-Pro Plus v. 6.0 software (Olympus, Japan).

