Fig. 1.
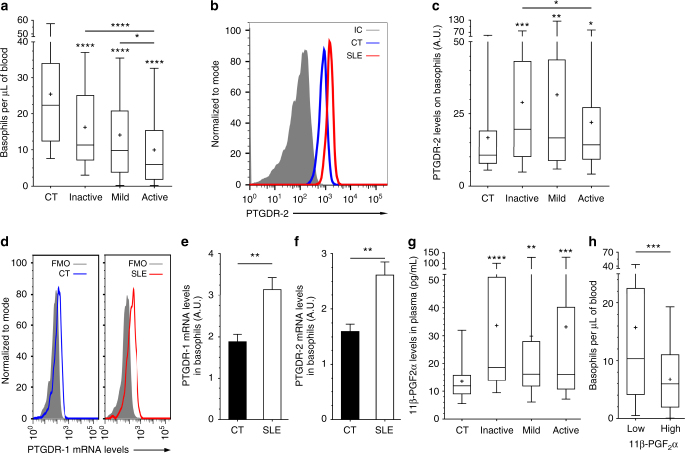
PGD2-PTGDR axis is associated with basopenia in SLE. a Basophils per µL of blood from CT and inactive, mild or active SLE patients (n = 116/55/42/103, respectively) as determined by FACS as described in Supplementary Fig. 1. b Representative FACS analysis of PTGDR-2 expression on blood basophils from a healthy control (CT), a patient with active SLE and isotype control (IC) staining. c PTGDR-2 levels on blood basophils from patients as in (a) (n = 101/49/34/78, respectively). d Representative FACS histograms of PrimeFlowTM RNA Assay showing PTGDR-1 RNA transcript expression by basophils from CT and active SLE individual compared to fluorescence minus one (FMO). e, f PTGDR-1 (e) and PTGDR-2 (f) RNA transcript expressions in basophils from CT (n = 6) and active SLE patients (n = 7) (ratio MFI/FMO) as in (d). g 11β-prostaglandin F2α (11β-PGF2α) levels in plasma from patients as in (a) (n = 44/33/28/66, respectively). h Basophils per µL of blood in patients with SLE grouped by low (n = 84) or high (n = 39) 11β-PGF2α plasma levels (high = levels above CT mean + 2 standard deviations). a, c, e–h Data are presented as median and interquartile ranges with whiskers representing 5–95 percentiles and the mean presented as a “+” symbol. Statistical analyses were by Mann−Whitney tests. e, f Data are presented as mean ± s.e.m. Statistical analyses were by unpaired Student t tests. a, c, e–h NS: not significant, *P < 0.05, **P < 0.01, ***P < 0.001, ****P < 0.0001. Comparison to control group is shown above each bar and to the corresponding bars when indicated. A.U. arbitrary units

