Fig. 3.
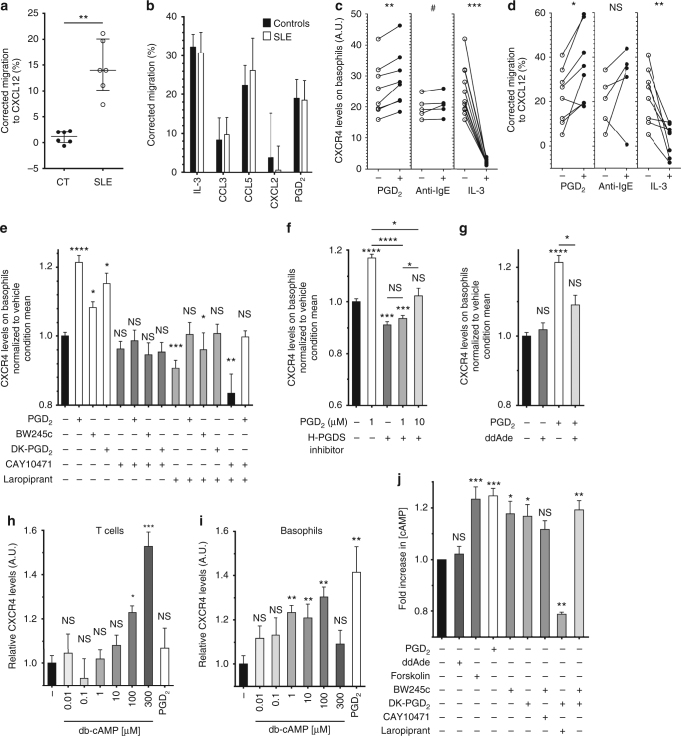
CXCR4-dependent basophil migration is enabled by both PTGDR. a, b Migration assays of human blood basophils from CT (n = 6) and active SLE patients (n = 6) towards CXCL12 (a) and towards IL-3, CCL3, CCL5, CXCL2, and PGD2 (b) from healthy controls (Controls, n = 8/4/3/4/7, respectively) and from SLE patients (SLE, n = 6/3/6/3/5, respectively). c, d FACS analysis of CXCR4 expression levels (c) and migration towards CXCL12 (d) of purified CT human blood basophils after 18 h of incubation without (−) or with (+) 1 µM PGD2, anti-human IgE antibodies or IL-3. e, f, g CXCR4 expression levels were assessed as in (c) on purified human blood basophils after 4 h of incubation with 1 µM of the indicated compounds (except for ddAde: 50 µM) (PTGDR-1 agonist: BW245c, antagonist: Laropiprant; PTGDR-2 agonist: DK-PGD2, antagonist: CAY10471). Data are normalized to the mean value of the vehicle condition. For each condition, 3−12 independent experiments were conducted. h, i CXCR4 expression levels on mouse CD45+CD3+TCRβ+ T cells (h) and basophils (i) in splenocytes incubated 4 h without (−) or with the indicated concentration of db-cAMP or 1 µM PGD2 as determined by flow cytometry as described in Supplementary Fig. 1. j Fold increase in cAMP concentration in purified human basophils stimulated for 15 min with 1 µM of the indicated compound (except for ddAde (50 µM) and Forskolin (10 µM)) normalized to the unstimulated condition (pool of six independent experiments). a Data are expressed as medians and interquartile ranges. b, e–j Data are presented as mean ± s.e.m. a–j Statistical analyses were by Mann−Whitney tests (a, b), paired Student t test (c–i) or by Tukey’s multiple comparisons test (j). a–j NS: not significant, #P = 0.06, *P < 0.05, **P < 0.01, ***P < 0.001, ****P < 0.0001. Comparison to control group is shown above each bar and to the corresponding bars when indicated. A.U. arbitrary units

