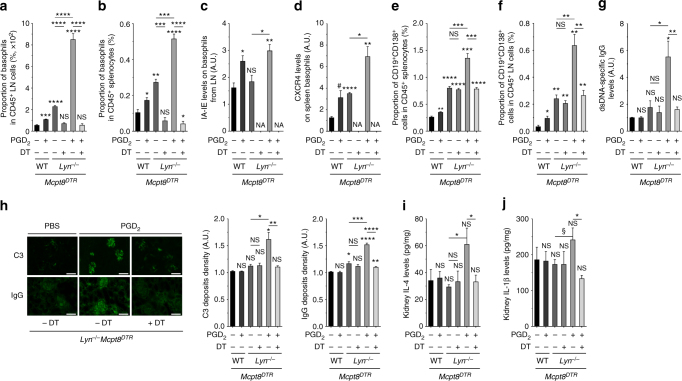
Fig. 5.
PGD2 injections induce basophil-dependent disease acceleration in young Lyn–/– mice. a, b Proportion of basophils among living CD45+ cells in lymph nodes (LN) (a) (cervical, brachial, and inguinal) and in spleen (b) from young Mcpt8DTR (WT) or Lyn–/– Mcpt8DTR (Lyn–/–) mice injected over 10 days with PBS or PGD2 along or not with diphtheria toxin-mediated basophil depletion (DT) as described in the Methods. From left to right, n = 3/4/4/4/4/5. c, d IA-IE expression on LN basophils (c) and CXCR4 expression on spleen basophils (d) in mice as in (a). NA not applicable. e, f Proportion of CD19+CD138+ cells among living CD45+ cells in spleen (e) and lymph nodes (f) in mice as in (a). g dsDNA-specific IgG levels in serum from mice as in (a). h Representative immunofluorescence staining for C3 and IgG deposits in kidneys from young Lyn–/– Mcpt8DTR mice treated as indicated (scale bar = 500 µm) and quantifications of these deposits in mice as in (a). i, j IL-4 and IL-1β levels in kidney protein extracts from mice as in (a). a–f Parameters were assessed by flow cytometry as described in Supplementary Fig. 4a–c and 8. g, i, j Parameters were assessed by ELISA. a–j Data are presented as mean ± s.e.m. Statistical analyses were by unpaired Student t tests. NS: not significant, #P = 0.06, §P < 0.1, *P < 0.05, **P < 0.01, ***P < 0.001, ****P < 0.0001. Comparison to control group is shown above each bar and to the corresponding bars when indicated. A.U. arbitrary units

