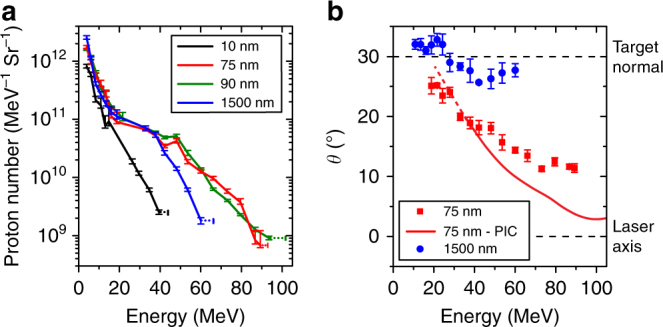
Fig. 2.

Measurements of proton beam spectrum and direction. a Example proton energy spectra, as deconvolved from the RCF measurements, for given foil thickness, . The horizontal error bars at the maximum energy are defined by the energy corresponding to the last RCF layer for which proton signal is measured (lower limit) and the energy of the next RCF layer (upper limit). The vertical error bars are defined by the level of uncertainty in the calibration of the RCF. b Measured angle of the centre of the proton beam, θ, with respect to the laser axis (in the plane of the incident laser beam), as a function of energy, for = 75 nm (red) and 1.5 μm (blue). The error bars are defined by the uncertainty in determining the angle of the centre of the proton beam from application of a beam fitting routine. An example PIC simulation result for = 75 nm (red curve) is included for comparison. The dashed lines mark the target normal and laser axis, for ease of reference
