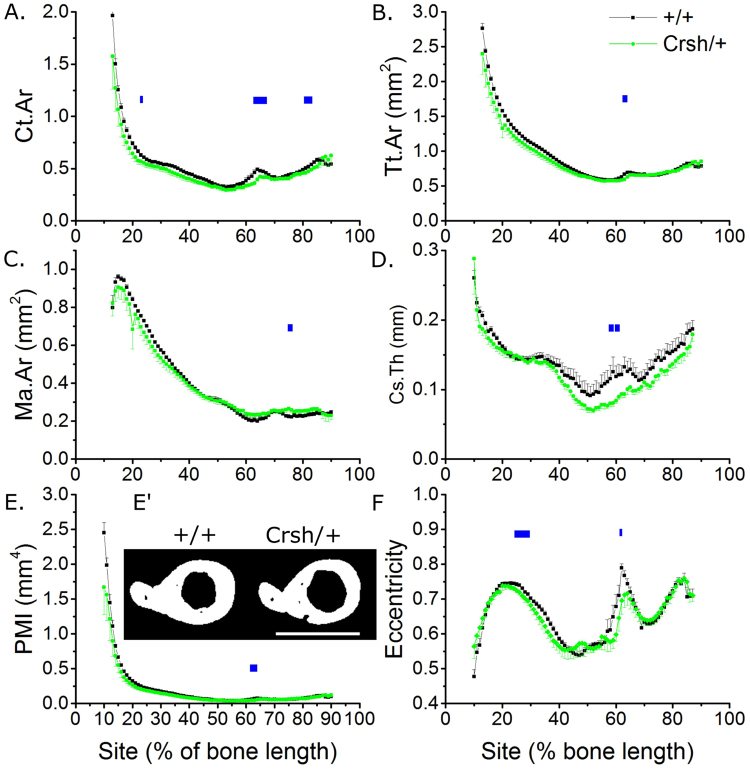
Figure 5.
Celsr1Crsh/+ mutation is associated with regionally smaller cortical bone mass in the tibia of young male mice. SSA µCT analysis of cortical bone structure at each 1% site along the bone’s length in 3-week-old male Celsr1+/+ and Celsr1Crsh/+ littermates (n = 8 each). (A) Ct.Ar, (B) Tt.Ar, (C) Ma.Ar, (D) Cs.Th, (E) PMI and (F) eccentricity were quantified. (E’) µCT cross-sections through the tibia immediately distal to the tibula/fibula junction (62% site). Scale bar = 1 mm. Blue lines indicate regions of significant differences between genotypes by mixed model analysis with Bonferroni post-hoc.

