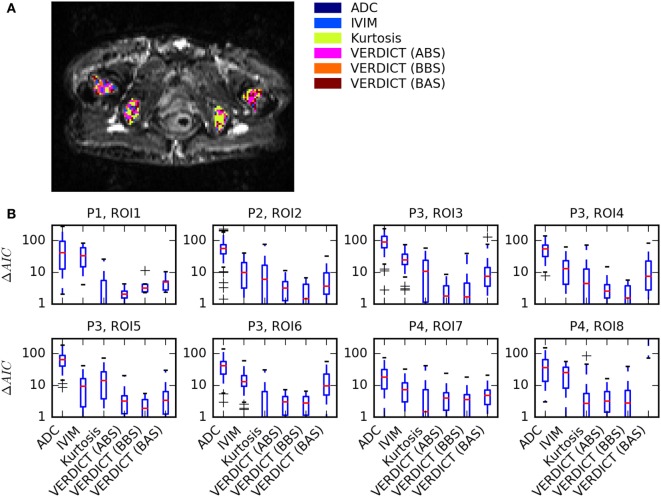
Figure 2.
Summary of model selection results. (A) Map showing the model that best explained the data [lowest Akaike Information Criterion (AIC)] in each voxel for one patient. (B) Boxplots of ΔAIC, where the red median lines indicate that Kurtosis, Astrosticks–Ball–Sphere (ABS), and Ball–Ball–Sphere (BBS) models tend to have similarly low AICs in most voxels, but the larger upper range of the Kurtosis box indicates that some voxels are better explained using VERDICT.

