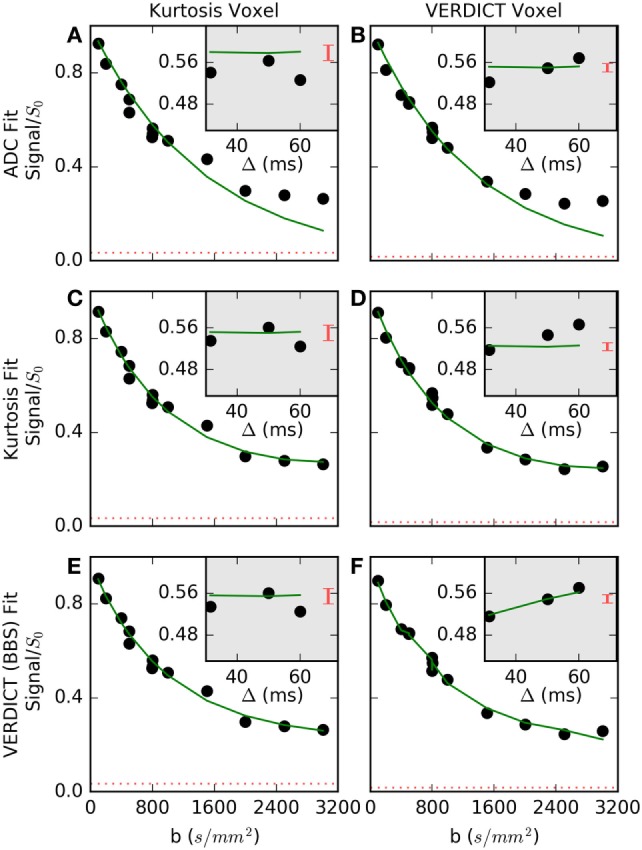
Figure 3.

Normalized signal and selected fits are shown for (A,C,E) a voxel where Kurtosis best described the data and (B,D,F) a voxel where Vascular, extracellular, and restricted diffusion for cytometry in tumors (VERDICT) [Ball–Ball–Sphere (BBS)] best described the data. The apparent diffusion coefficient (ADC) model (A,B) failed at high b-values in both voxels. In the first voxel (C,E), the Kurtosis and VERDICT models provided similar fits, so, Kurtosis was selected as the simpler model. In the second voxel (D,F), the gray insets showed the signal for three points with b = 800 s/mm2, where Kurtosis is unable to capture signal changes with different gradient separations, Δ, and VERDICT better explained this time-dependence. The dashed red lines and the red bars in the insets both indicate the noise level, demonstrating that it is difficult to detect a time-dependent trend in the first voxel beyond the larger relative noise level.
