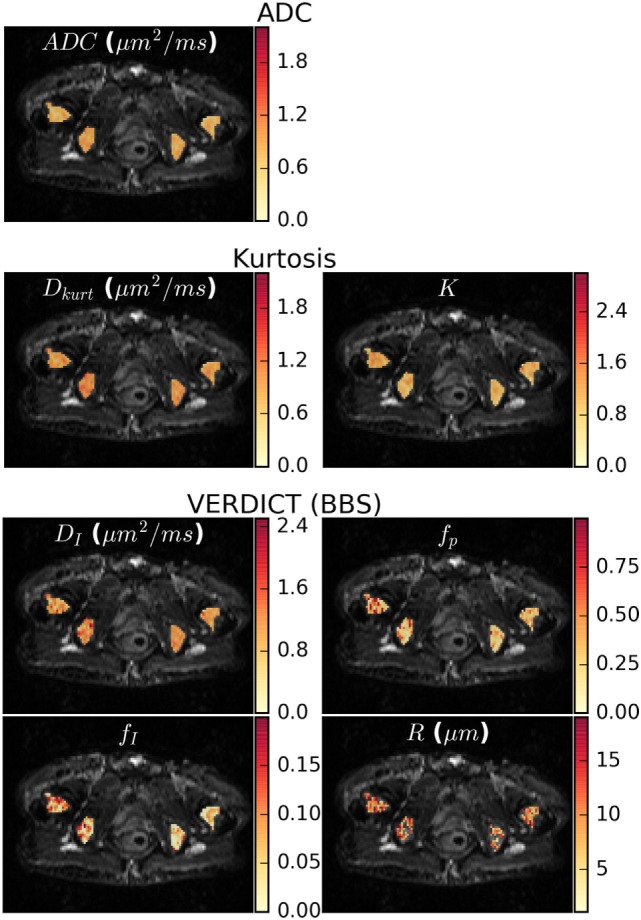
Figure 4.

Parameter maps for the apparent diffusion coefficient (ADC), kurtosis, and vascular, extracellular, and restricted diffusion for cytometry in tumors (VERDICT) [Ball–Ball–Sphere (BBS)] models. There was some apparent heterogeneity in the ADC map and the Dkurt and DI parameters from the kurtosis and VERDICT models showed similar patterns. For VERDICT, the intracellular volume fraction (fI) and perfusion fraction (fp) maps appeared heterogeneous, but with a different pattern. Several voxels in the radius (R) maps hit the fitting lower bound and were not plotted. These correspond to regions where the Kurtosis model provided better fit in Figure 2A and had low fI, meaning that the radius was poorly determined. Parameter maps for the remaining patients can be seen in the Supplementary Material.
