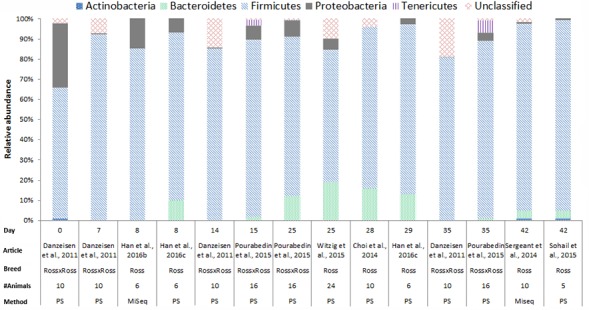
FIGURE 3.

The composition of the cecal microbiota in Ross broilers at phylum level. General composition of the cecal microbiota in Ross broilers across different ages, from control groups, not exposed to specific treatments. The data is from eight different studies, based on 16S rRNA 454 pyrosequencing (PS), n = 6 and MiSeq sequencing n = 2. Danzeisen et al. (2011), the data from the supporting information Supplementary Table S1 was used. Han et al. (2016b), the data from Figure 6, the first bar of the histogram was used. Han et al. (2016c), the data from Figure 7, pie chart A and C was used. Pourabedin et al. (2015), the data from the supplementary data, Supplementary Figure S1A was used. Witzig et al. (2015), the data from the Supplementary Data, Supplementary Table S4 was used. Choi et al. (2014), data from Figure 1 was used. Sergeant et al. (2014), the data from the Supplementary Data 1 was used. Sohail et al. (2015), the data from Supplementary Table 2 was used.
