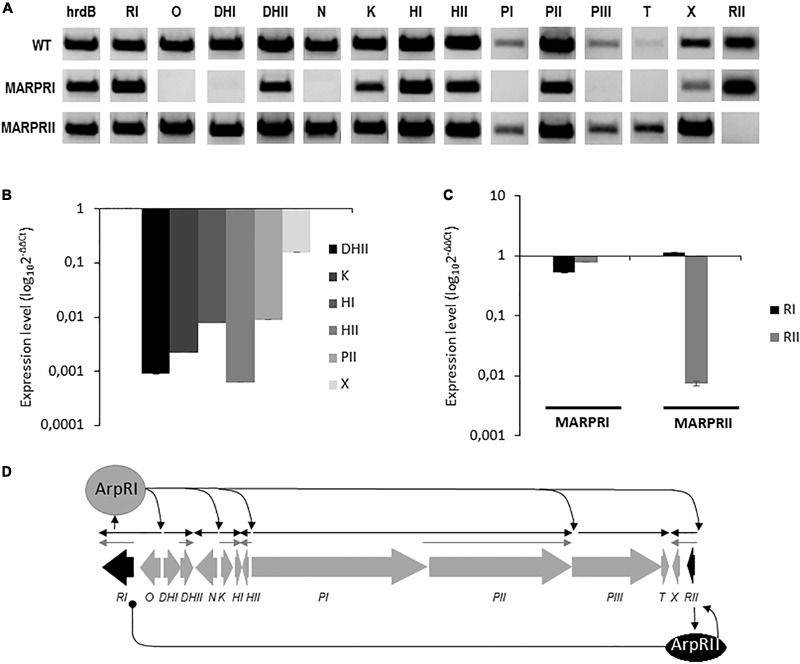
FIGURE 7.

Gene expression analysis of the arp gene cluster. (A) Transcription analysis by RT-PCR of arp genes in the wild type (WT) and in regulatory mutants S. argillaceus MARPRI and MARPRII. The band intensity represents the level of transcription of each gene in the different strains. Expression of the hrdB gene was used to standardize the concentration of RNA. qRT-PCR quantification of the expression levels of (B) selected arp genes in MARPRI strain, and (C) of regulatory genes arpRI and arpRII in regulatory mutants MARPRI and MARPRII. Graphs show the relative expression of these genes in relation to the WT strain (WT), in (B) MARPRI, and (C) in MARPRI and MARPRII mutants. (D) Proposed model for transcriptional regulation of the arp gene cluster. Regulatory genes are represented in black. Black arrows indicate deduced transcriptional units ArpRI-dependent. Gray arrows indicate deduced transcriptional units ArpRI-independent. Sharp-ended and round-ended arrows indicate activation and repression, respectively.
