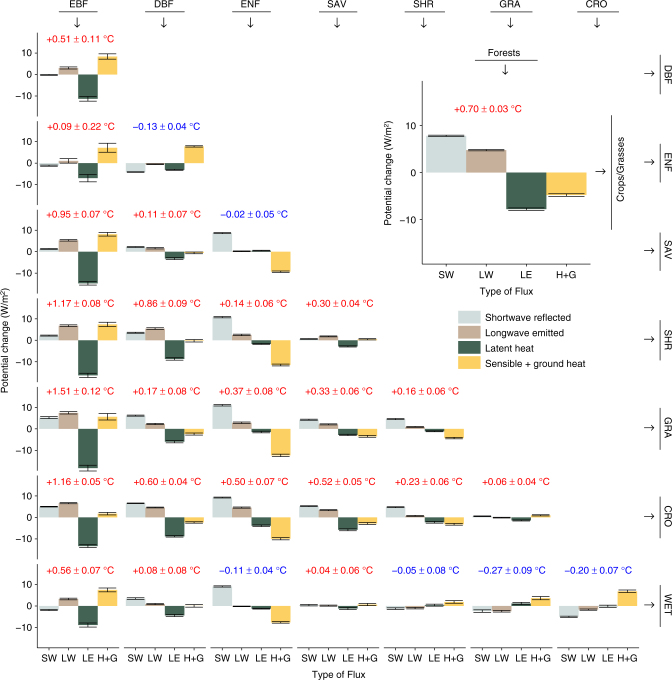
Fig. 3.
Global summary of the mean annual potential change in surface energy balance and temperature for various transitions in vegetation type as derived from satellite observations. The transitions shown involve the following vegetation classes: evergreen broadleaf forests (EBF), deciduous broadleaf forests (DBF), evergreen needleleaf forests (ENF), savannas (SAV), shrublands (SHR), grasslands (GRA), croplands (CRO) and wetlands (WET). Because transitions are symmetric, reverse transitions can be derived by inverting the sign. The inset shows a more generic transition from forests to either crops or grasses corresponding to the maps shown in Figs. 1 and 2. For each transitions, the mean change is provided for the shortwave reflected radiative flux (SW), longwave emitted radiative flux (LW), latent heat flux (LE) and the combination of sensible and ground heat fluxes (H+G). The number above the bars represents the mean surface temperature change observed for that transition ± two times the standard error around the mean, as do the confidence intervals represented on the bar charts of the flux values

