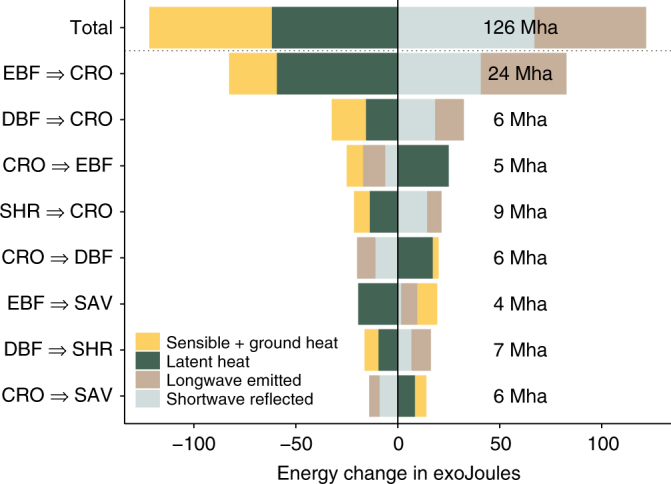
Fig. 5.

Cumulated changes in energy for each component of the surface energy balance resulting from recent major vegetation transitions. Transitions are sorted according to decreasing absolute change in the surface energy balance. The changed area per transition, calculated based on the ESA CCI land cover maps of 2015 and 2000, are reported in megahectares on the right of the bars. The transitions shown involve the following vegetation classes: evergreen broadleaf forests (EBF), deciduous broadleaf forests (DBF), savannas (SAV), shrublands (SHR) and croplands (CRO)
