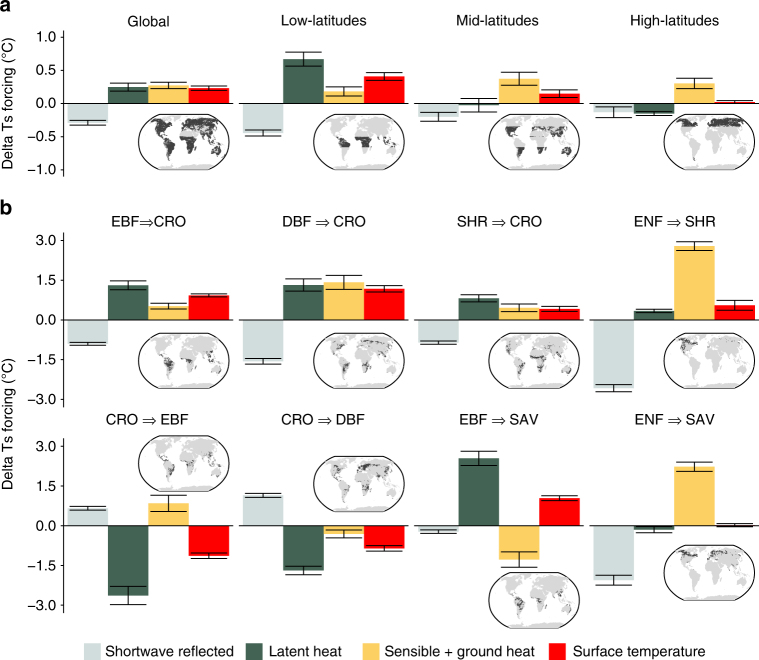
Fig. 6.
Changes in surface temperature resulting from major vegetation transitions between 2000 and 2015. The bars represent the respective contribution of each component of the surface energy balance to the change in surface temperature (Ts). a Illustrates changes at global scale or divided by broad latitudinal bands, while b shows changes for a selection of transitions types involving the following vegetation classes: evergreen broadleaf forests (EBF), deciduous broadleaf forests (DBF), evergreen needleleaf forests (ENF), savannas (SAV), shrublands (SHR) and croplands (CRO). Each bar represents the mean of all changed pixels weighted by the actual change within each 1° pixel. The errorbars represent ± two times the weighted standard error around the weighted mean

