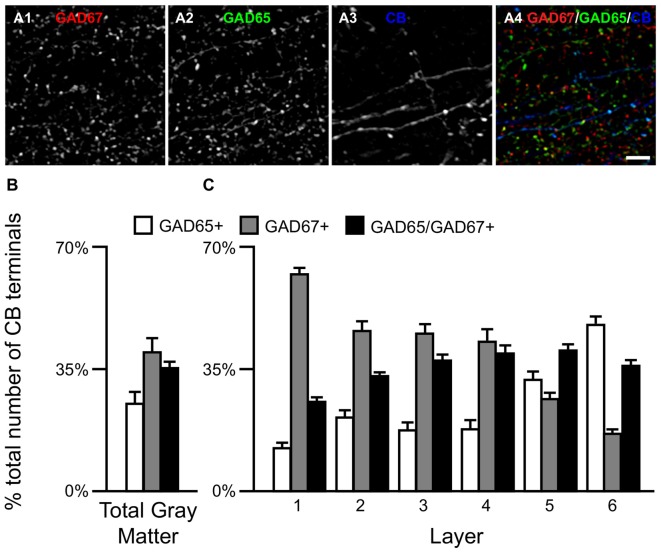
Figure 3.
The proportion of three CB/GAD+ terminal subpopulations differs across cortical layers. (A) Projection image (6 z-planes separated by 0.25 μm) of a human PFC tissue section immunolabeled for CB, vGAT (not shown), GAD65 and GAD67. Gray scale images (A1–A3) are single channel images of the multichannel image (A4) and are representative of the immunohistochemistry labeling. Scale bar = 5 μm. (B,C) Bar graphs showing the relative proportions of vGAT/CB+ terminals in PFC that were GAD65+, GAD67+, or GAD65/GAD67+. Error bars = SEM.

