
Figure 6.
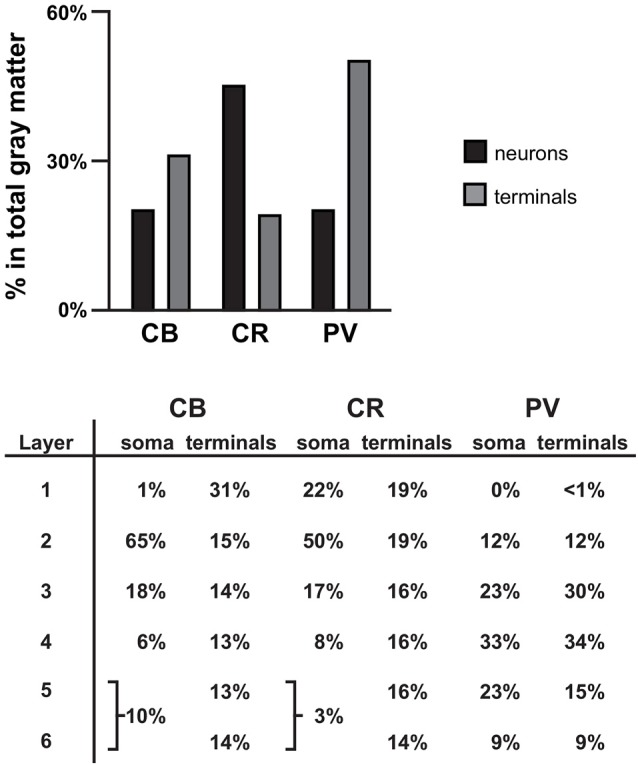
Summary. Bar graph showing the percentage of all γ-aminobutyric acid (GABA) neurons (black bars) and terminals assessed (gray bars) that is CB+, CR+, or PV+ in PFC total gray matter. Table showing the distribution of soma and terminals for each of the three GABA neuron subtypes across the six cortical layers. The soma data for CB and CR were taken from previously published findings in human PFC (Daviss and Lewis, 1995).