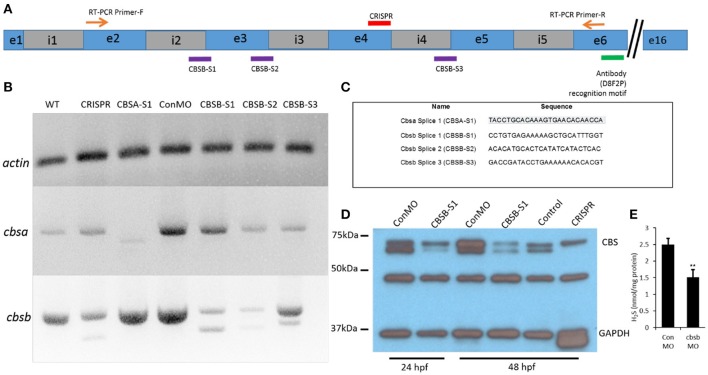
Figure 2.
Loss-of-function efficacy studies. Panel (A) shows a “partial” cartoon representation of the cbsb genomic site with the location of the MO sites (purple rectangles) at appropriate intron (i) and exon (e) junctions, CRISPR-targeted site (red rectangle), site of RT-PCR forward (F) and reverse primers, and the antibody recognition site. Panel (B) shows RT-PCR for three genes (cbsb, cbsa, actin) in total RNA from injected embryos (~24 hpf) (left to right): wild type (WT) control and cbsb CRISPR-injected fish, cbsa splice 1 (CBSA-S1), control morpholino (ConMO), cbsb splice1 (CBSB-S1), cbsb splice 2 (CBSB-S2), cbsb splice 3 (CBSB-S3). Panel (C) shows the sequence of the morpholinos used in this study. Panel (D) shows CBS and GAPDH western blots for ConMO, CBSB-S1 at 24 and 48 hpf along with control and cbsb CRISPR fish at 48 hpf. Panel (E) shows the comparison between CBSB-S1 MO and ConMO-injected embryos for hydrogen sulfide production. n = 3 for both groups (data from three experiments). Twenty embryos in each group in each experiment. **P < 0.01.

