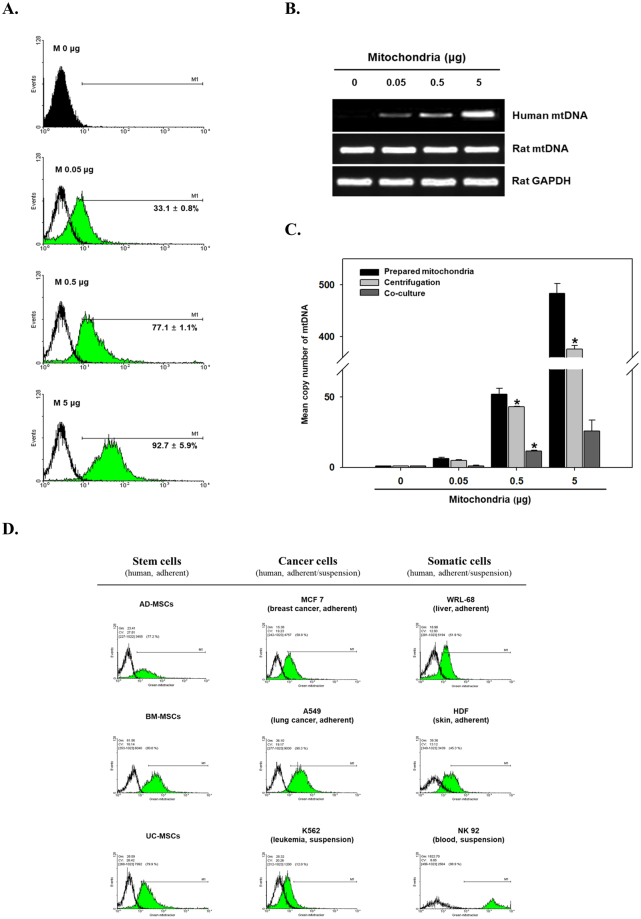
Figure 2.
Effect of mitochondrial dose on mitochondrial delivery efficiency. (A) Flow cytometric analysis of MitoTracker Green fluorescence in UC-MSCs at 24 h after transfer of various amounts of mitochondria (expressed as μg of protein). (B) qPCR analysis of human mtDNA (h-mtDNA), rat-mtDNA and rat-glyceraldehyde-3-phosphate dehydrogenase (GAPDH) in rat L6 muscle cells after transfer of mitochondria isolated from UC-MSCs. (C) Real-time PCR analysis of the mean h-mtDNA copy number of mitochondria isolated from UC-MSCs for transfer (prepared mitochondria in bar definition), rat L6 cells after mitochondrial transfer via centrifugal force (centrifugation) and rat L6 cells after 1 day of co-culture (co-culture). Relative mtDNA copy numbers normalised to the GAPDH level are shown. All values are mean ± SEM. N = 3, *P < 0.05 vs. normal UC-MSCs (0 μg). (D) Comparison of the transfer efficiency, as determined by the intensity of green fluorescence, by various cell types upon centrifugation for 5 min at 1,500 × g. The information of all cell lines were represented in Supplementary information section.

