Fig. 1.
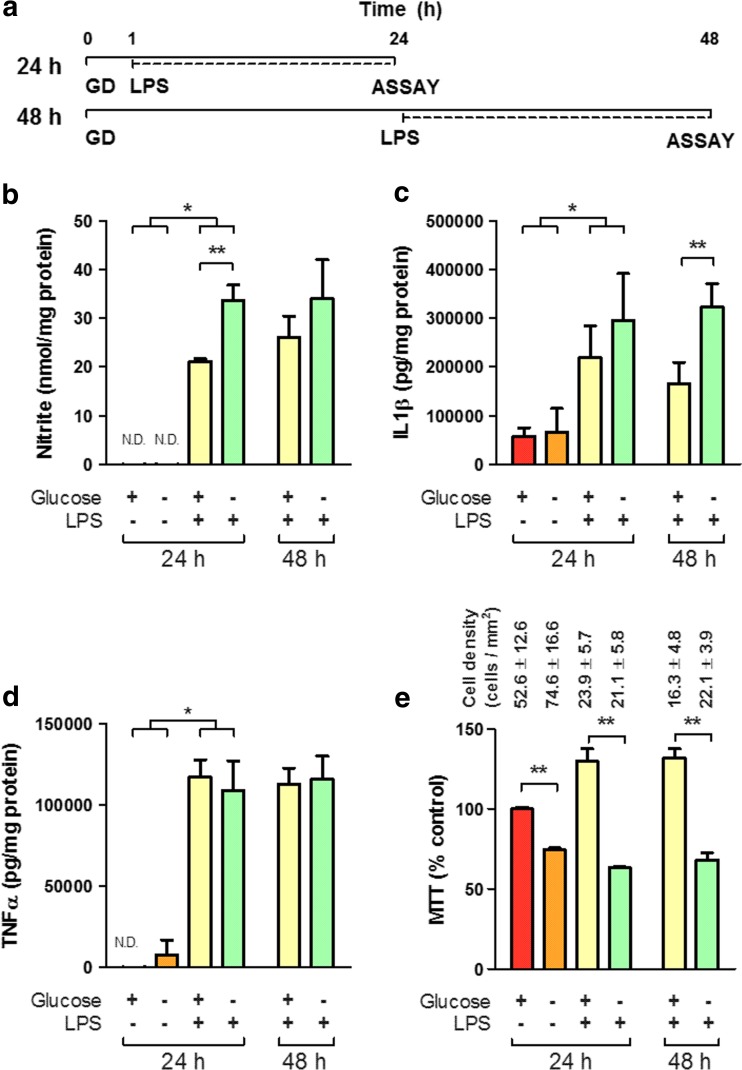
Glucose deprivation is insufficient to induce inflammatory release from microglia. a Schematic timeline of treatment paradigm. For each condition, GD began 1 or 24 h (for 24 or 48 h total time points, respectively) prior to 24 h 100 ng/ml LPS treatment. b–d Release of NO (b), IL1β (c) and TNF (d) is significantly increased by treatment with LPS. GD increases release of NO and IL1β significantly above the LPS treated, normal glucose condition at 24 and 48 h, respectively (N = 4). MTT assay (e), a measure of oxidative phosphorylation, was significantly decreased in microglia subject to glucose deprivation relative to normal glucose at 24 h, and in the presence of LPS at 24 or 48 h (N = 8). Numbers indicate mean cell density for each condition as determined from a parallel assay plate. N.D. not determinable. Asterisk indicates significant groupwise differences by two-way ANOVA between control and LPS and Double asterisk indicates pairwise significance by Bonferroni’s post hoc

