Fig. 1.
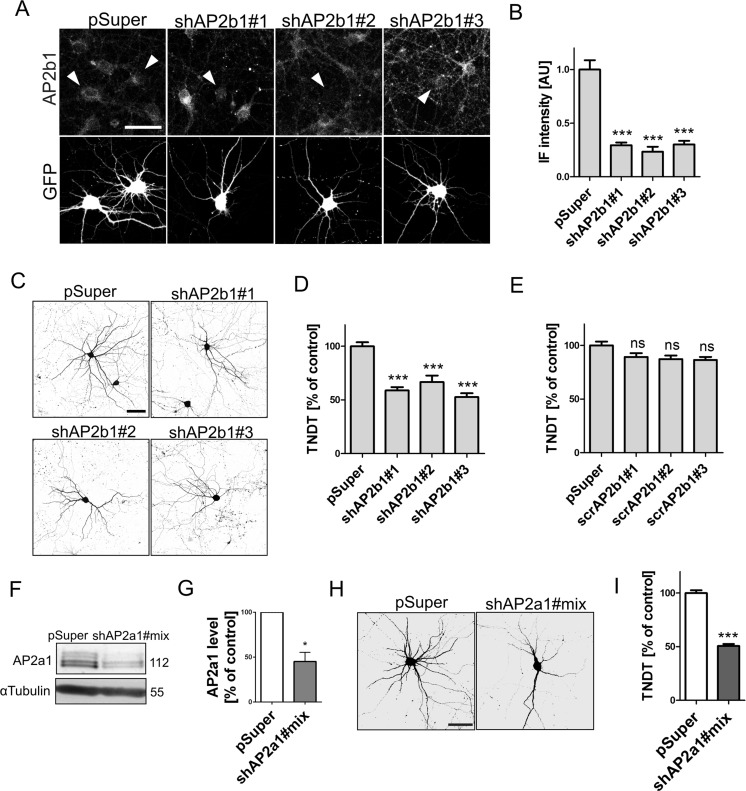
AP2 controls dendritic arbor morphology in neurons cultured in vitro. a Representative confocal images of DIV10 cultured hippocampal neurons immunofluorescently stained for AP2b1. Cells were transfected on DIV8 for 2 days as indicated. Neurons were additionally co-transfected with GFP-encoding plasmid for the identification of transfected cells (arrowheads). Scale bar = 50 μm. b Quantification of level of AP2b1 immunofluorescence in the cell body of neurons transfected as in a. The data are expressed as a mean value normalized to control ± SEM. ***p < 0.001 (Kruskal-Wallis test followed by Dunn’s multiple-comparison test). Cell images were obtained from two independent culture batches. Number of cells per variant (n): pSuper (22), shAP2b1#1 (23), shAP2b1#2 (18), and shAP2b1#3 (22). c Representative confocal images of cultured hippocampal neurons transfected on DIV8 for 4 days as indicated. Neuron morphology was visualized by co-transfection with GFP. Scale bar = 50 μm. d Total number of dendritic tips (TNDT) of neurons transfected as in c. The data are expressed as a mean value normalized to control ± SEM. ***p < 0.001 (Kruskal-Wallis test followed by Dunn’s multiple-comparison test). Cell images were obtained from two independent culture batches. Number of cells per variant (n): pSuper (36), shAP2b1#1 (36), shAP2b1#2 (17), and shAP2b1#3 (37). e TNDT of hippocampal neurons transfected on DIV8 for 4 days with a plasmids scrambled shRNAs against AP2b1. The data are expressed as a mean value normalized to control ± SEM. ns, nonsignificant (Kruskal-Wallis test followed by Dunn’s multiple-comparison test). Cell images were obtained from two independent culture batches. Number of cells per variant (n): pSuper (25), scrAP2b1#1 (20), scrAP2b1#2 (21), and scrAP2b1#3 (21). f Western blot analysis of α-adaptin (AP2a1) and tubulin in protein lysates obtained from cortical neurons nucleofected on DIV0 for 2 days with empty pSuper or a pool of pSuper plasmids that encoded shRNAs against α-adaptin. g Results of quantitative WB analysis of cell lysates obtained from neurons nucleofected as in f. *p < 0.05 (one-sample t test). Number of independent experiments (N) = 3. Error bars indicate SEM. h Representative confocal images of cultured hippocampal neurons transfected on DIV7 for 3 days as indicated. Neuron morphology was visualized by co-transfection with GFP-encoding plasmid. Scale bar =50 μm. i TNDT of neurons transfected as in h. The data are expressed as a mean value normalized to control ± SEM. ***p < 0.001 (Mann-Whitney test). Cell images were obtained from four independent culture batches. Number of cells per variant (n): pSuper (78) and shAP2a1#mix (75)

