Fig. 3.
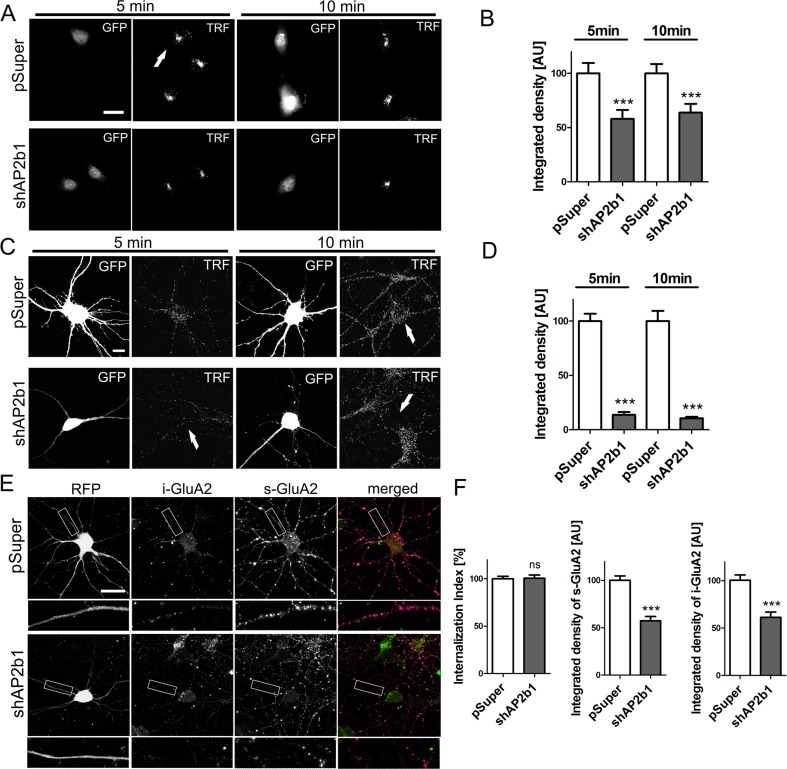
In developing neurons, AP2 contributes to endocytosis of transferrin receptor but not GluA2 under basal culture conditions. a Representative confocal images of RAT2 fibroblasts exposed to fluorescently labeled transferrin. Cells were electroporated for 2 days with empty pSuper or pSuper-shAP2b1#2 (shAP2b1) and pEGFP-C1 for the identification of transfected cells (arrows). After 2 days, the cells were starved overnight prior to 5 or 10 min fluorescently labeled transferrin uptake. Scale bar = 20 μm. b Quantification of integrated density of transferrin fluorescence in the cell body of RAT2 fibroblasts transfected and treated as in a. The data are expressed as a mean value normalized to control. Error bars indicate SEM. ***p < 0.001 (Mann-Whitney test). Cell images were obtained from four independent culture batches. Number of cells per variant (n): pSuper (55) and shAP2b1 (49) for 5 min uptake and pSuper (72) and shAP2b1 (52) for 10 min uptake. c Representative confocal images of cultured hippocampal neurons exposed to fluorescently labeled transferrin. DIV7 neurons were transfected (arrows) for 3 days as indicated. On DIV10, cells were starved for 3 h prior to 5 or 10 min fluorescent transferrin uptake. Scale bar = 10 μm. d Quantification of integrated density of transferrin fluorescence in the cell body of neurons transfected and treated as in c. The data are expressed as a mean value normalized to control. Error bars indicate SEM. ***p < 0.001 (Mann-Whitney test). Cell images were obtained from five independent culture batches. Number of cells per variant (n): pSuper (44) and shAP2b1 (52) for 5 min uptake and pSuper (50) and shAP2b1 (50) for 10 min uptake. e Representative confocal images of cultured hippocampal neurons transfected as indicated on DIV7 for 3 days and subjected to the GluA2 internalization assay. i-GluA2, internalized pool of GluA2; s-GluA2, surface pool of GluA2. Scale bar = 20 μm. f Quantitative analysis of integrated density of s-GluA2 and i-GluA2 dendritic fluorescence and GluA2 internalization index in neurons transfected and treated as in e. For s-GluA2 and i-GluA2, the data are expressed as a mean value normalized to control ± SEM. The internalization index was calculated using the following formula: i-GluA2/s-GluA2 + i-GluA2. The results are presented as a mean value normalized to control ± SEM. ns, nonsignificant; ***p < 0.001 (Mann-Whitney test). Cell images were obtained from five independent culture batches. Number of cells per variant (n): pSuper (50) and shAP2b1 (48)

