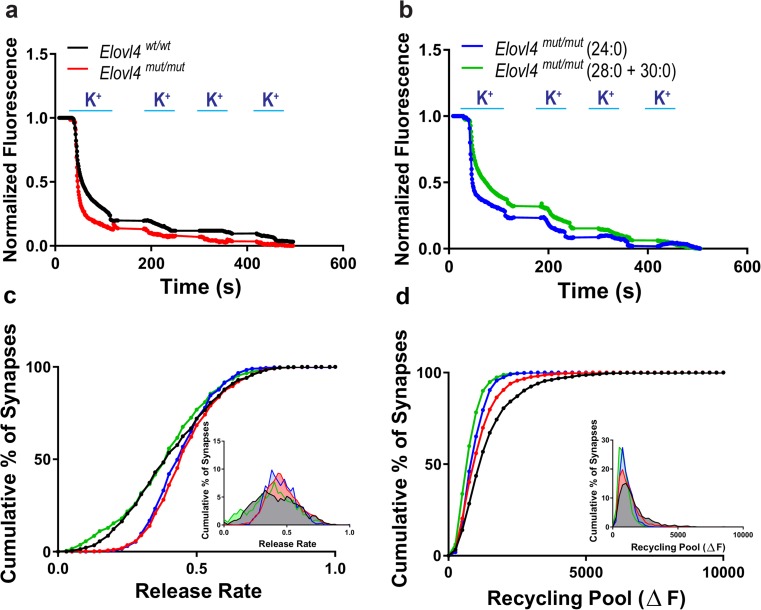
Fig. 5.
Dysregulation of synaptic vesicle release in mutant neurons lacking ELOVL4. FM1-43 fluorometric assessment of synaptic vesicle release rates and pool size in E18.5 primary hippocampal cultures collected from Elovl4 wt/wt and Elovl4 mut/mut embryos +/− treatment with either 28:0 + 30:0 or 24:0. a Representative destaining curves comparing release rates in WT (black) and mutant animals (red) in response to high K+ depolarization. b Representative destaining curves comparing release rates in mutant animals supplemented with either 24:0 (blue) or 28:0 + 30:0 (green) in response to high K+ depolarization. c Cumulative distribution of release rates for all synapses measured (Kolmogorov–Smirnov non-parametric examination of equality, p < 0.001). Inset: Frequency distribution of responses with slowest responding synapses falling to the left and the fastest to the right on the curve. d Cumulative distribution of the recycling pool of synaptic vesicles measured as total fluorescence released during the course of the experiment for all synapses measured. Inset: Frequency distribution of total fluorescent load turned over by each synapse with the synapses made up of the smallest pool at any given moment in time falling to the left, and those synapses with a larger pool at any given moment falling to the right of the curve

