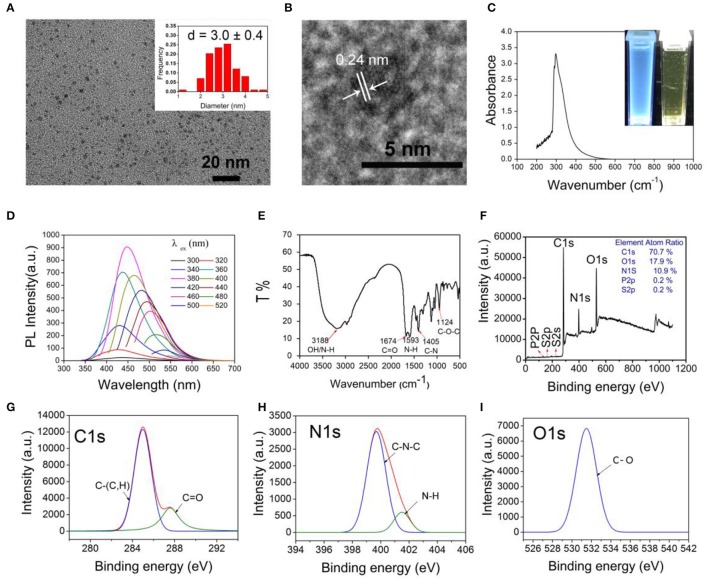
Figure 1.
Characterization of CDs-LP. (A) TEM image and the corresponding size distribution histogram of CDs-LP (inset). (B) The high-resolution TEM image of CDs-LP. (C) UV–vis absorption spectra of CDs-LP in water. The insets are photographs of CDs-LP in water with and without irradiation under a 365 nm UV lamp. (D) Fluorescence spectra of CDs-LP dispersed in water. (E) FTIR spectra of dried CDs-LP. (F) XPS spectrum of dried CDs-LP and the high-resolution XPS peaks of C1s (G), N1s (H) and O1s (I).

