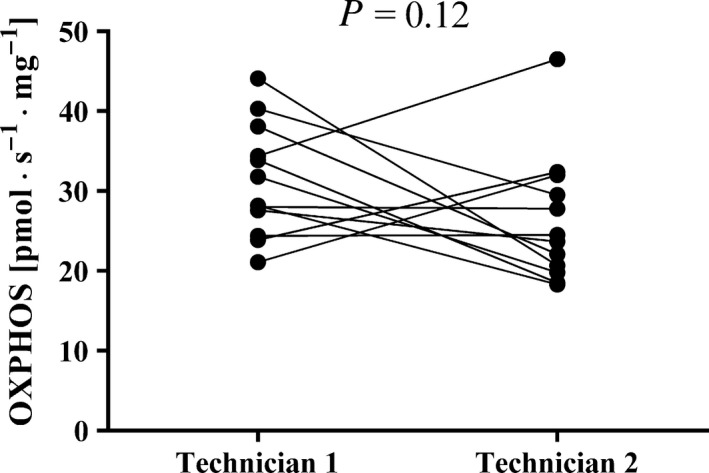
Figure 4.

The variance in maximal mitochondrial oxidative phosphorylation (OXPHOS) by bundles of fibers from the same biopsy as measured by two experienced technicians. Each measurement is represented by a filled circle. Two measurements performed in the same respirometer at the same time of the day, but with permeabilization by the different technicians are connected with a line. P indicates the level of significance (no significant difference was observed).
