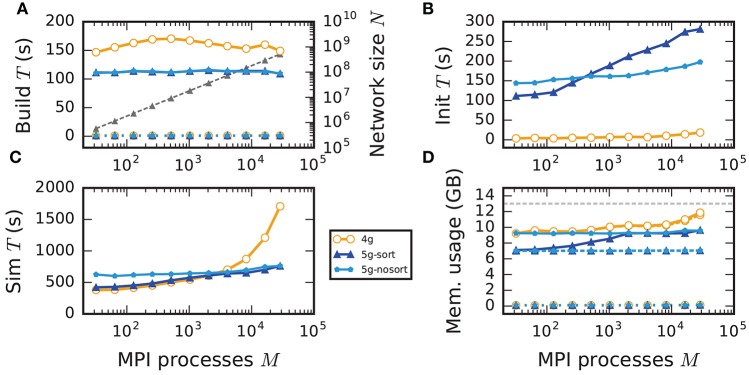
Figure 7.
Weak scaling of an archetypal neuronal network simulation on a petascale computer. Runtime and memory usage per compute node for an increasing number of MPI processes M ∈ {32; 64; 128; 256; 512; 1024; 2048; 4096; 8192; 16, 384; 28, 672} with one MPI process and T = 8 threads per compute node on JUQUEEN. Each compute node hosts NM = 18,000 neurons with K = 11,250 incoming synapses per neuron. Network dynamics simulated for 1 s of biological real time. Color code in all panels: 4g (orange), 5g without optimizations for pre-petascale (5g-nosort, light blue), and 5g with optimizations (5g-sort, dark blue). (A) Build time of nodes (dashed lines) and connections (solid lines); 5g-sort data covered by 5g-nosort data. Gray triangles and dashed line show the total network size N (right vertical axis). (B) Init time. (C) Sim time. 4g data partly covered by 5g-sort data. 5g-sort data partly covered by 5g-nosort data. (D) Cumulative memory usage for a single MPI process after construction of neurons (dotted lines; < 140 MB), after construction of connections (dashed lines), and after simulation including pre-simulation (solid lines). 5g-sort data partly covered by 5g-nosort data. Horizontal gray dotted line indicates the maximum memory available on a single compute node of JUQUEEN.

